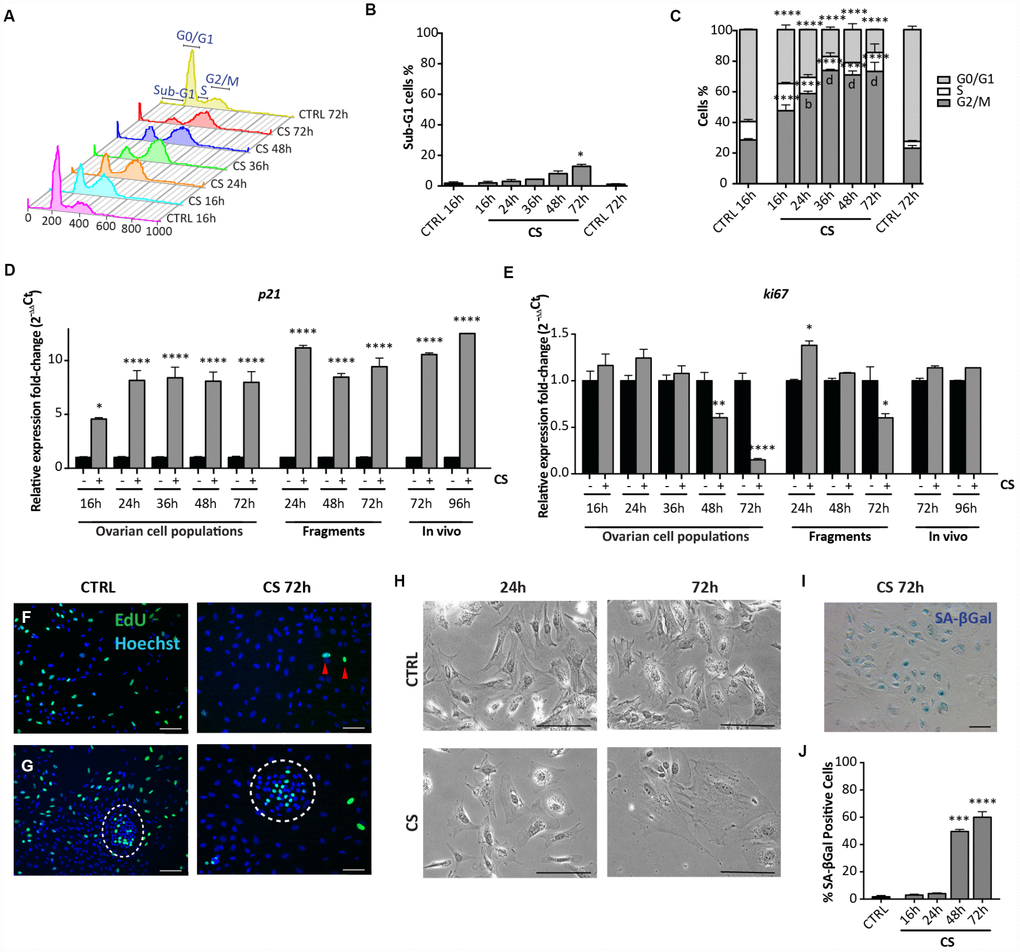
Figure 4.Analysis of CS-induced senescence in ovarian somatic cells in vitro and in vivo. (A–C) Cells treated with 10 μM CS for the indicated times, were analyzed by flow cytometry in order to quantify (C) cell cycle distribution and (B) apoptosis (sub-G1). Results are expressed as mean ± SEM of three experiments. Statistical differences vs control *p<0.05 ****p<0.0001 Statistical differences vs 16hrs in the G2/M phase b = p<0.01 d = p<0.0001. No significant differences were observed between 36, 48 and 72 hrs in the G2/M phase. (D, E) Comparison of qRT-PCR analysis for (D) p21 and (E) ki67 between in vitro (dispersed ovarian somatic cells and ovarian fragments) and in vivo (ovaries from intraperitoneal injected mice) conditions. Data are shown as mean ± SEM of three analyses. Statistical differences vs control *p<0.05 ****p<0.0001. (F, G) Representative staining for Click-iT EdU (green) in (F) scattered cells and in (G) colony of ovarian surface epithelium (OSE) cells (white circle) after 72 hrs of CS treatment. Red arrowheads indicate proliferating cells. Scale bar = 100μm. (H) Cultured ovarian somatic cells treated with CS acquired large and flattened morphology from 48 hrs onwards. (I, J) Representative image and quantification of SA-βgal activity positive cells after 72 hrs of CS treatment, scale bar = 100μm. Data are expressed as mean ± SEM of four experiments. Statistical differences vs control ***p<0.001 ****p<0.0001.