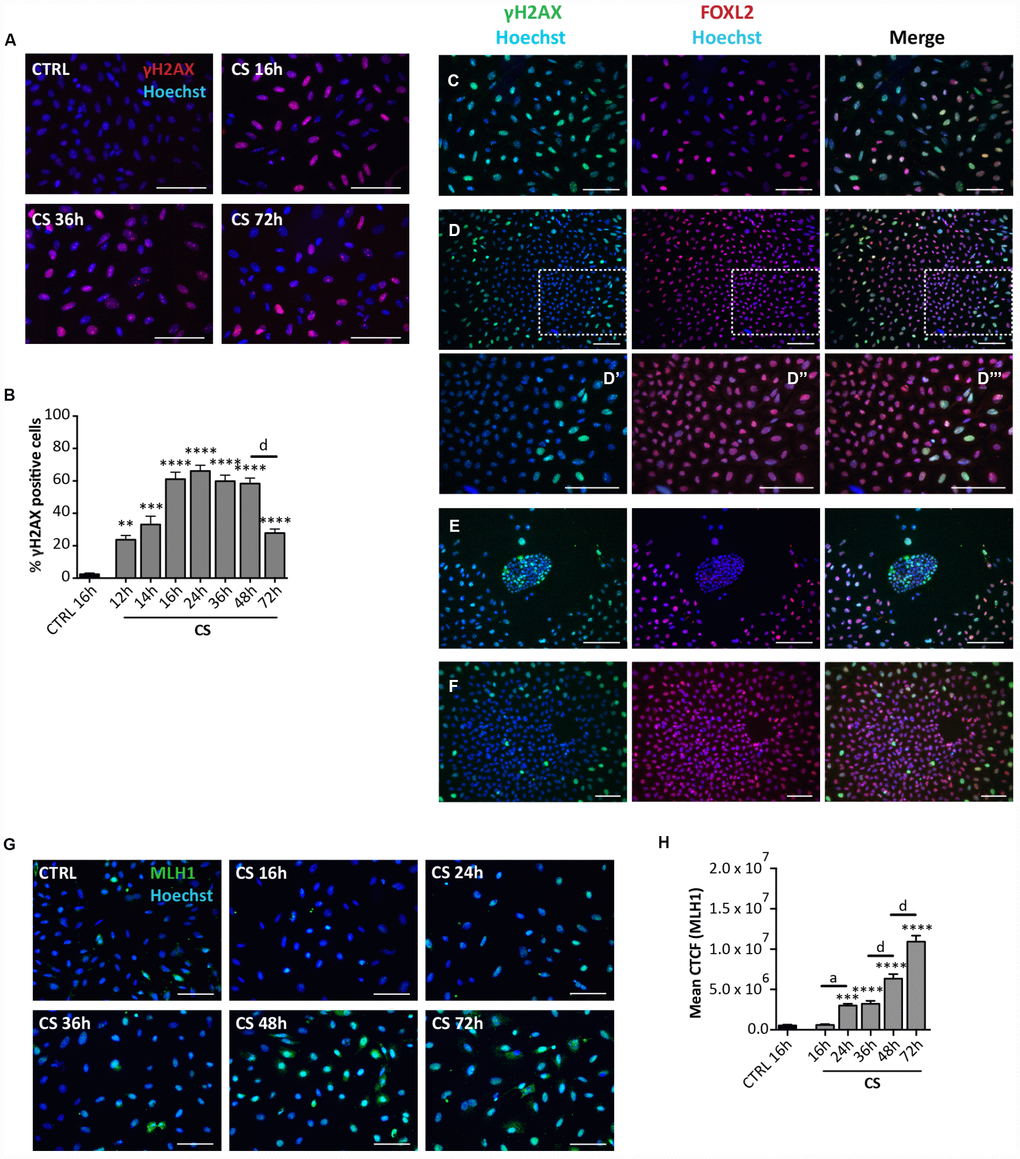
Figure 5.Analysis of CS-induced DNA damage in ovarian somatic cells in vitro. (A) Representative IF of cells stained with γH2AX (red) after 16, 36 and 72 hrs of treatment with 10 μM CS. (B) The graph reports the quantification of γH2AX positive cells percentage. Data are shown as mean ± SEM of three experiments. Statistical differences vs control **p<0.01 ***p<0.001 ****p<0.0001; CS 48 hrs vs CS 72 hrs d = p<0.0001. Note that cells showed a progressive increase in percent of positive cells that peaked after 16 hrs followed by a marked decrease at 72 hrs. (C–F) Representative double IF for γH2AX (green) and FOXL2 (red) in (C) scattered fibroblastoid and epithelioid cells, (D) a large epithelioid colony (D’–D’’’ higher magnifications from D), (E) a little colony of small epithelioid cells and (F) GCs from isolated secondary follicles after CS-treatment for 24 hrs. Scale bar = 100μm. (G) Representative IF of cells stained with MLH1 (green) after 16, 24, 36, 48 and 72 hrs of treatment with 10 μM CS. Scale bar = 100 μm (H) The graph reports the Mean Correlated Total Cell Fluorescence (CTCF) in ovarian cells treated with/out CS as indicated. The fluorescence intensity was determined in each cell by ImageJ software. Data are expressed as means ± SEM of three experiments. Statistical differences vs control ***p<0.001 ****p<0.0001; CS 16 hrs vs CS 24 hrs a = p<0.05; CS 36 hrs vs CS 48 hrs d = p<0.0001; CS 48 hrs vs CS 72 hrs d = p<0.0001. Note that cells showed a progressive increase in the nuclear expression of MLH1.