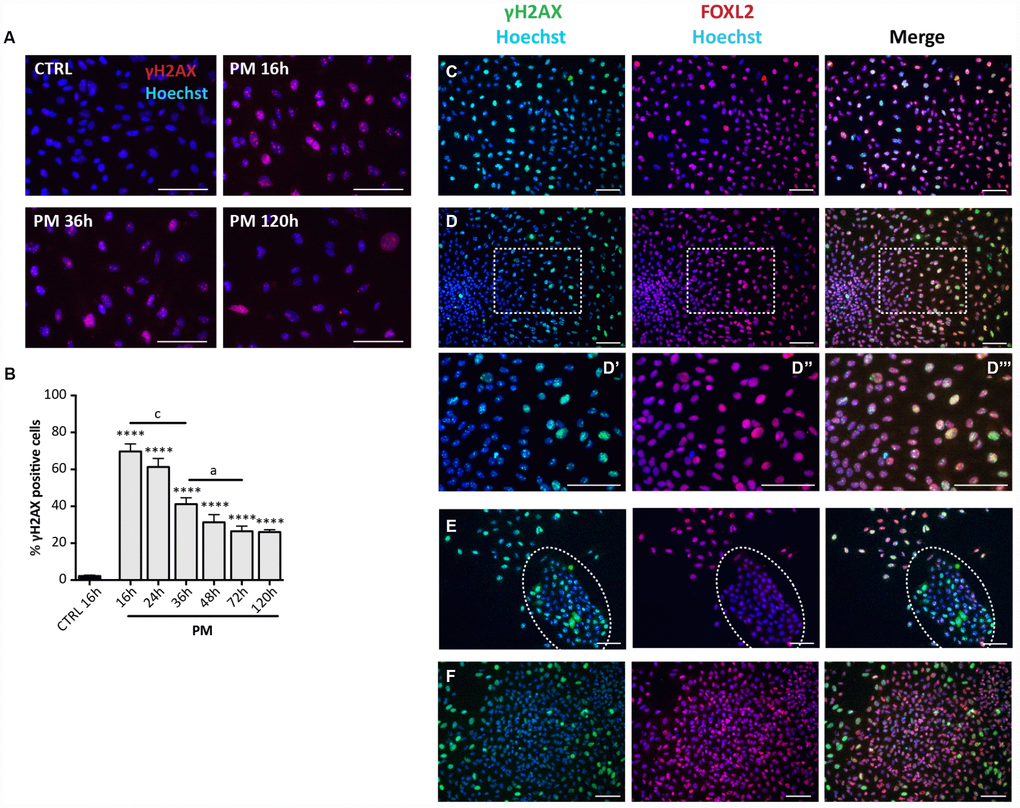
Figure 7.Analysis of PM-induced DNA damage in ovarian somatic cells. (A) Representative IF for γH2AX in somatic cells treated with PM. (B) The graph reports the quantification of γH2AX positive cells percentage. Data are shown as mean ± SEM of three experiments. Statistical differences vs control ****p<0.0001. CS 16 hrs vs CS 36 hrs c = p<0.001; CS 36 hrs vs CS 72 hrs a = p<0.05. Note an increase in the % of positive cells after 16 hrs of treatment followed by a progressive marked decrease up to 72 hrs. (C–F) Representative double IF for γH2AX (green) and FOXL2 (red) in (C) scattered fibroblastoid and epithelioid cells, (D) a large epithelioid colony (D’–D’’’ higher magnification images from D), (E) a little colony of small epithelioid cells (white circle) and (F) GCs from isolated secondary follicles after PM-treatment for 24 hrs. Scale bar = 100μm.