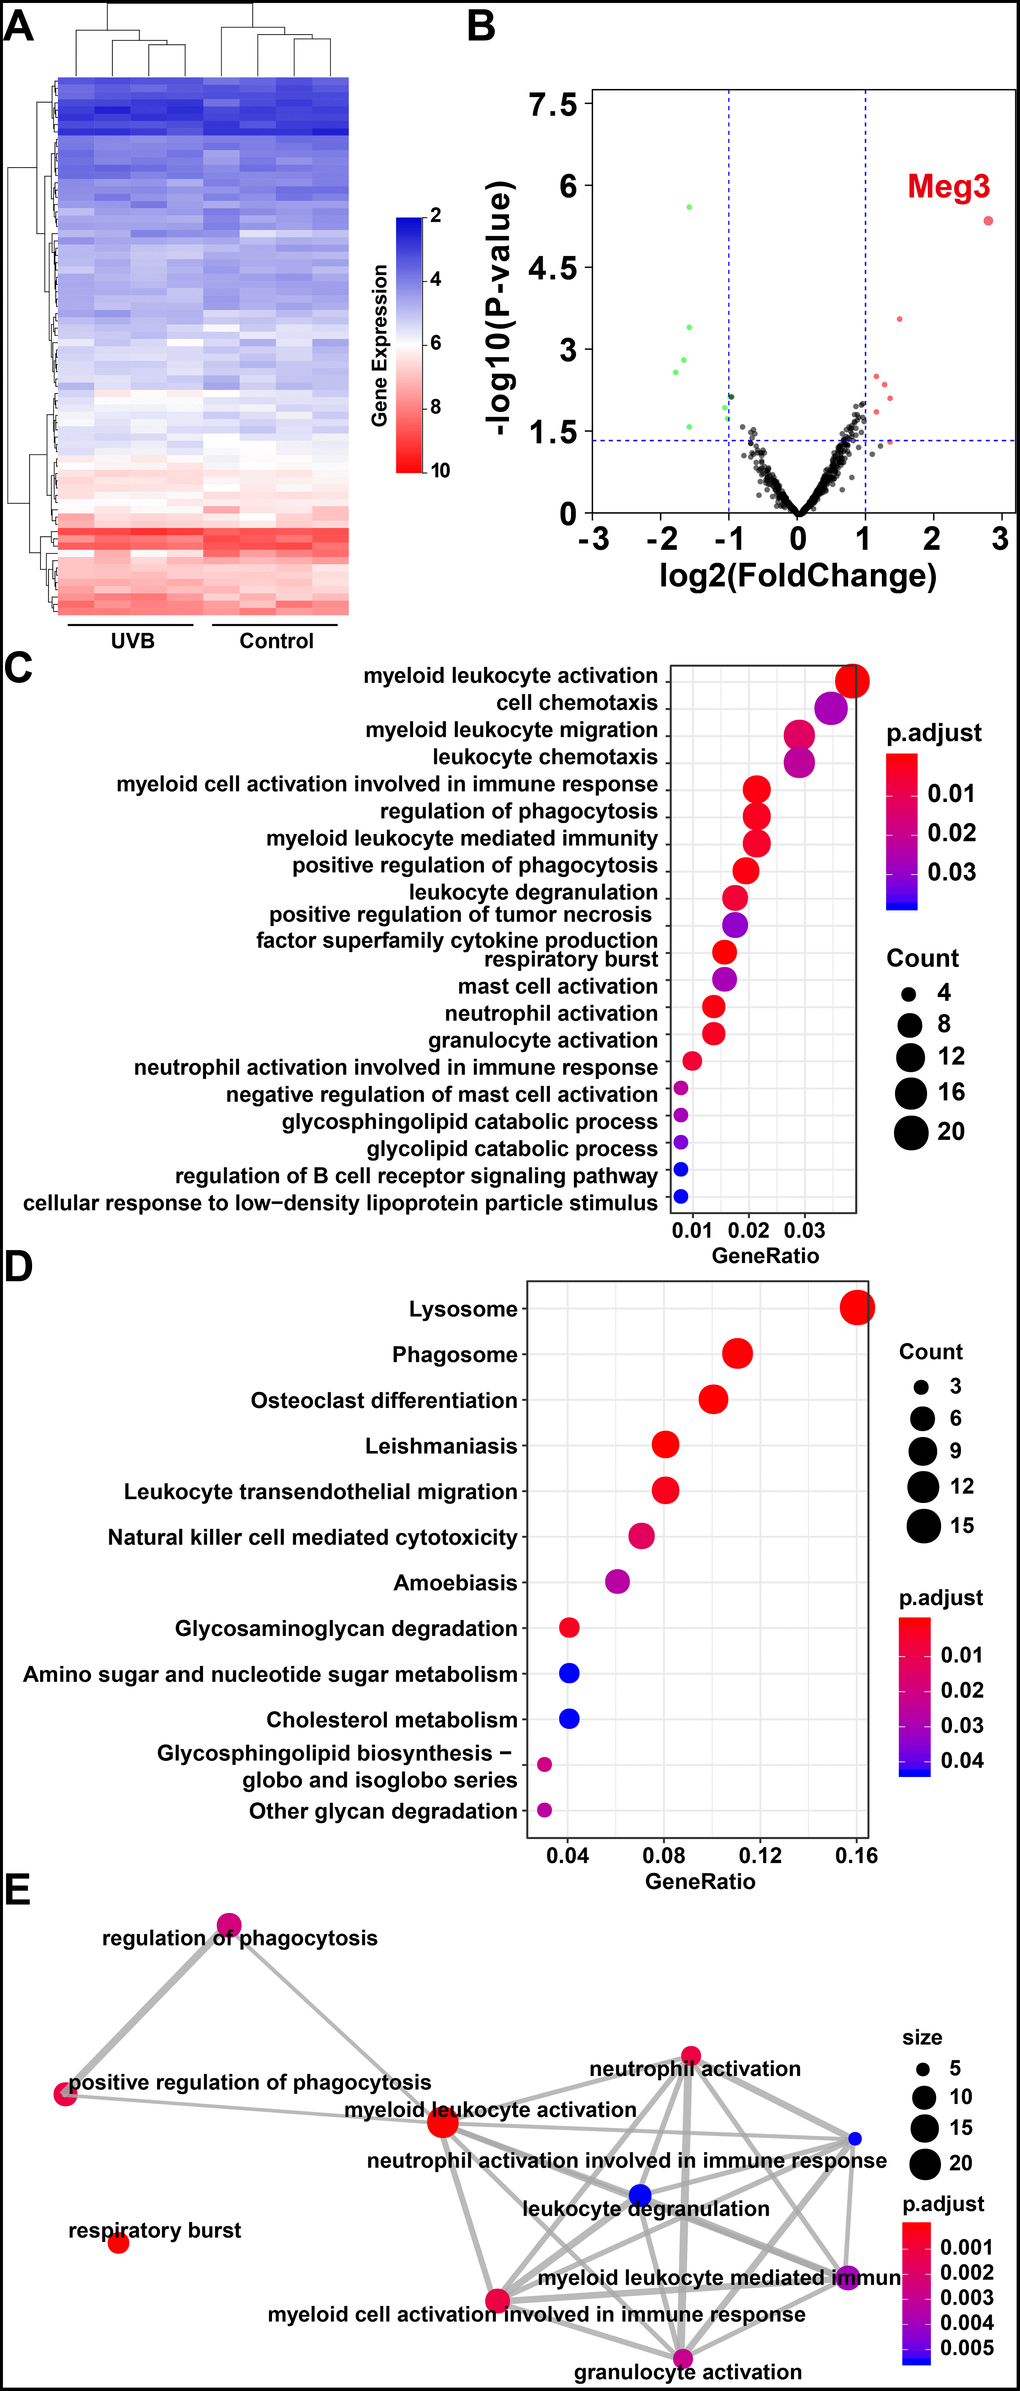
Figure 1.(A) Heat map of lncRNAs expression profiles of normal and UVB irradiated murine dorsal skin tissue groups. Red represents up-regulated lncRNAs and blue represents down-regulated lncRNAs. (B) Volcano plots of lncRNAs for normal and UVB irradiated murine dorsal skin tissue groups. The horizontal axis represents fold change (log 2) and the vertical axis is P value (−log 10). Red points (fold change > 1) indicate up-regulated lncRNAs, green points (fold change < −1) indicate down-regulated lncRNAs. Gene ontology analysis (C) and KEGG enrichment (D) of differentially expressed lncRNAs in normal and UVB irradiated murine dorsal skin tissue groups. The horizontal axis represents the proportion of those genes accounted for in all the annotated genes, the left side of the vertical axis represents the annotation terms. Bubble scale represents number of genes in each term; depth of bubble color represents p value. (E) The annotation terms are displayed as an interaction network by using the Reactome pathways. Bubble scale represents number of genes; depth of bubble color represents p value.