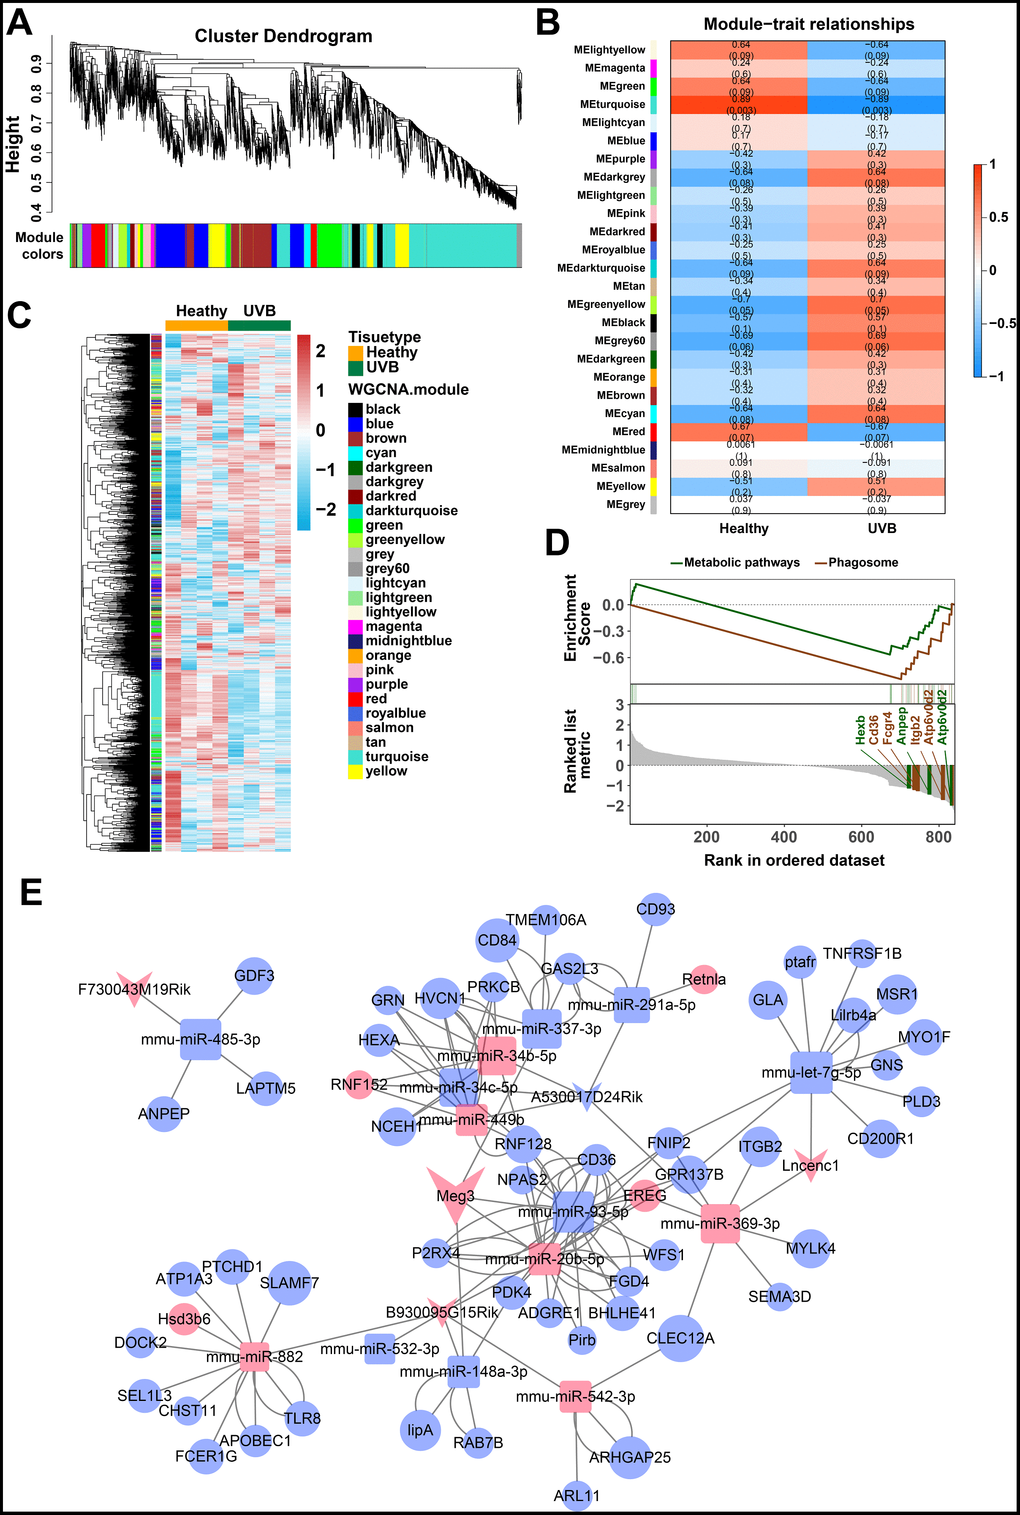
Figure 2.(A) Clustering dendrogram of genes by WGCNA. The dissimilarity of genes is based on topological overlap. The genes are assigned to different modules and are identified using different colors. (B) The relationship of each WGCNA co-expression modules between normal and UVB irradiated samples were investigated. (C) Heatmap of clustered genes in the co-expression modules. The different colors on the horizontal and vertical axis represent different groups and modules. The colors in the middle represents the relativity among each module. (D) The significant KEGG-GSEA pathways in differentially expressed mRNAs linked to lncRNAs. The horizontal axis represents the rank in all the ordered dataset, the vertical axes represent enrichment score and ranked list metric. (E) The lncRNA-mRNA-miRNA ceRNA network was constructed by five lncRNAs, 14 miRNAs and 54 mRNAs for UVB induced skin lesions.