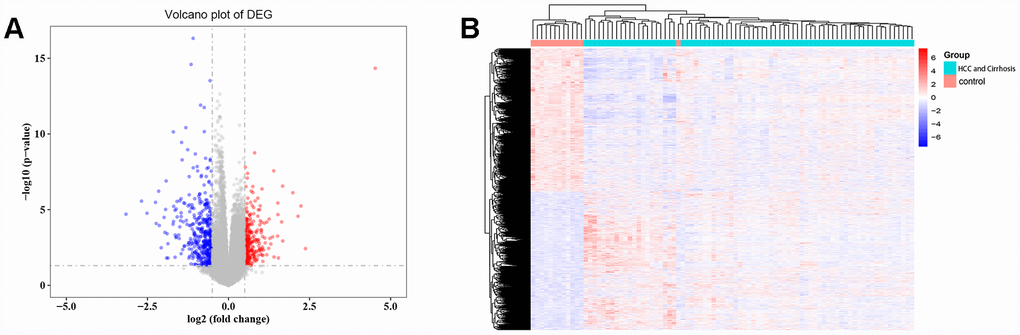
Figure 1.Differentially expressed gene (DEG) analysis. (A) Volcano plot of the DEGs. Red indicates upregulated and blue indicates downregulated in cirrhosis/HCC. (B) Hierarchical clustering dendrograms of the expression patterns of DEGs that can basically distinguish normal liver tissue and cirrhosis/HCC.