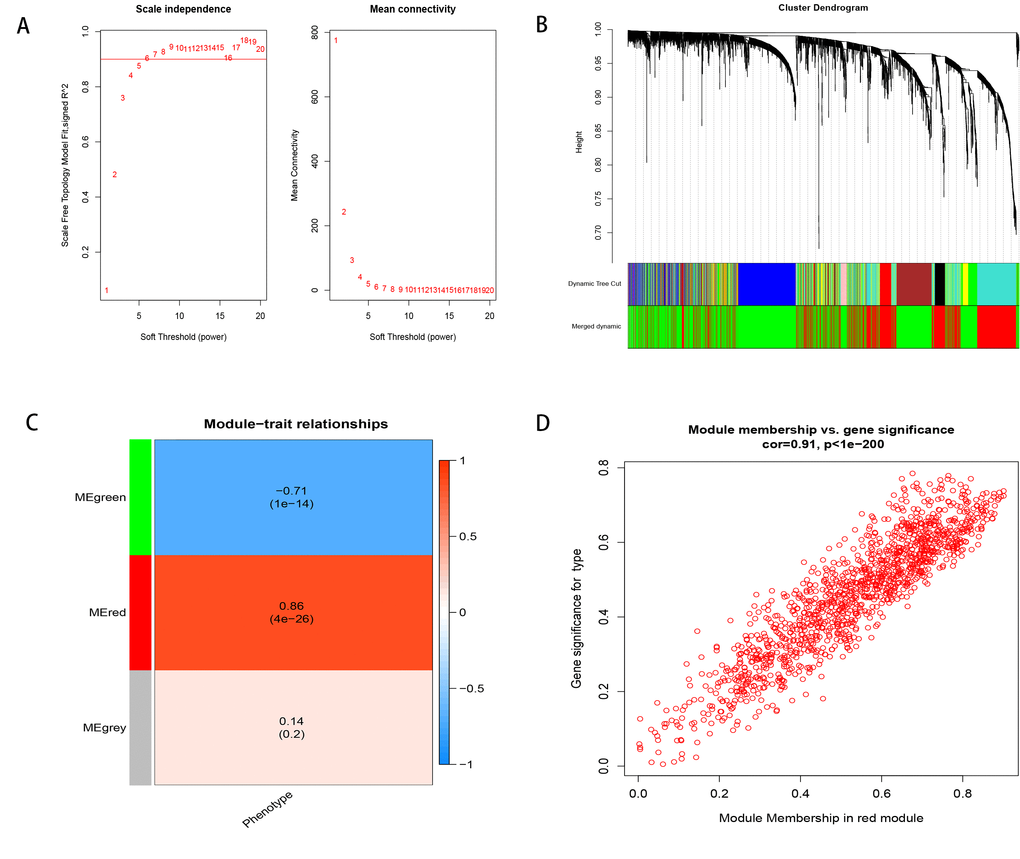
Figure 2.Weighted correlation network analysis. (A) Define power related to modules. (B) Recognition module. (C) The red module is positively correlated with phenotype, the green module is negatively correlated with phenotype, and gray is not related to phenotype. (D) MM and GS are highly correlated in the red module.