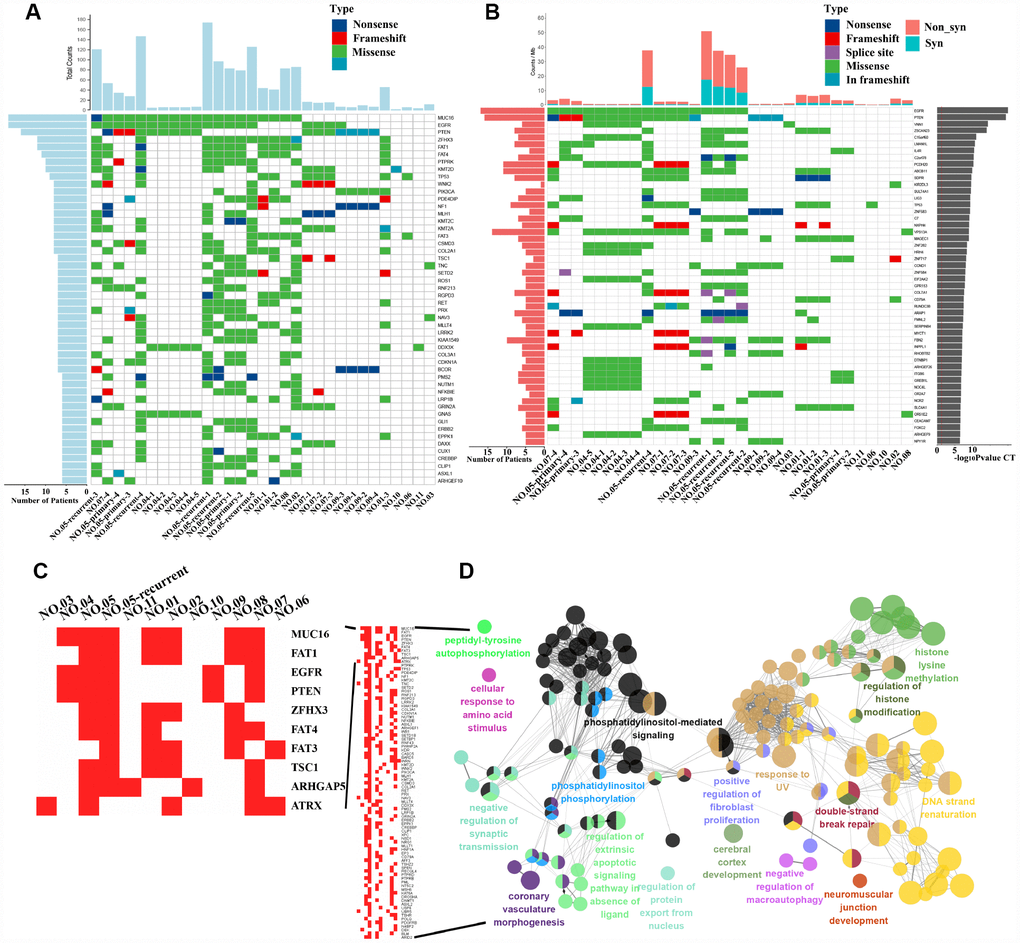
Figure 1.Driver gene mutation analysis and significantly mutated genes (SMGs) in GBM. (A) The top 50 driver genes with the highest mutation frequencies were selected for inclusion in the heat maps. The abscissa lists the sample names and the ordinate lists the gene names. The left graph shows the number of mutant samples and the top graph shows the number of mutated genes in each sample. (B) The graph on the right shows the log10 P-value of each gene mutation. The heat map (middle panel) presents gene mutations in GBM samples. The graph on the left shows the mutation frequency in the GBM samples examined. The mutant load is shown on the top of the heat map. (C) Mutation heatmap. (D) GO analysis.