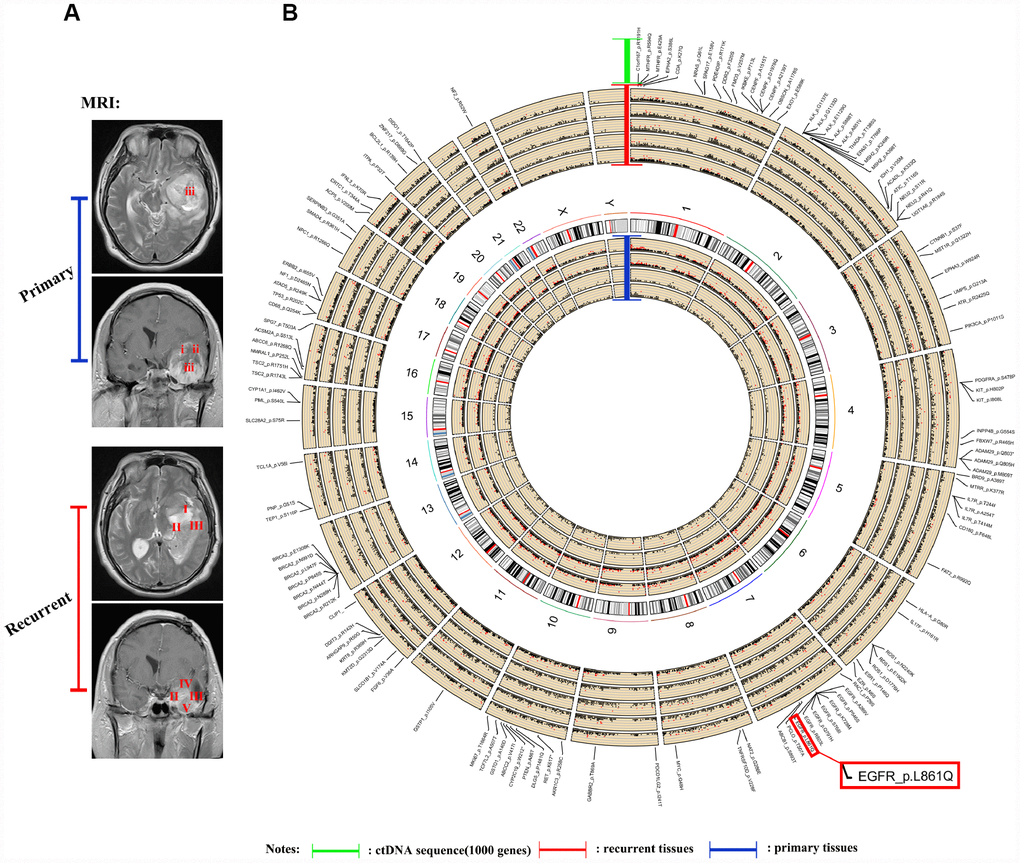
Figure 4.Sequencing and analysis of the ctDNA. (A) Magnetic resonance images show the different locations of tissue samples derived from patient NO. 05. (B) SNP density circos map of the primary and recurrent GBM samples from patient NO. 05. The first circle represents sample (i), the second circle represents sample (ii), the third circle represents sample (iii), the fourth circle represents the repeat of sample (iii), the fifth circle represents chromosomes, the sixth circle represents sample (I), the seventh circle represents sample (II), the eighth circle represents sample (III), the ninth circle represents sample (IV), the tenth circle represents sample (V), and the eleventh circle represents gene mutations detected using ctDNA testing.