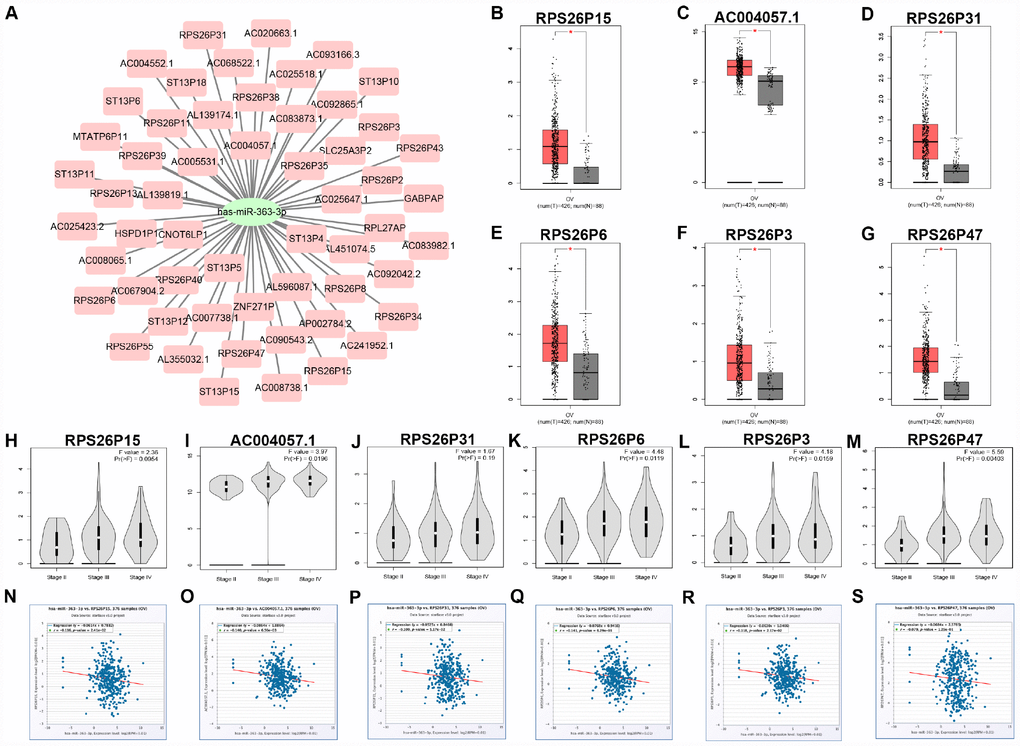
Figure 7.Identification of upstream potential pseudogenes of hsa-miR-363-3p in ovarian cancer. (A) The pseudogenes-hsa-miR-363-3p network constructed by Cytoscape. The expression levels of RPS26P15 (B), AC004057.1 (C), RPS26P31 (D), RPS26P6 (E), RPS26P3 (F) and RPS26P47 (G) in ovarian cancer compared with normal controls. “*” represents “P-value < 0.05”. Y axis indicates relative expression value, log2(TPM+1). TPM=Transcript per million. Expression differences of RPS26P15 (H), AC004057.1 (I), RPS26P31 (J), RPS26P6 (K), RPS26P3 (L) and RPS26P47 (M) among various major stage in ovarian cancer. P-value < 0.05 was considered as statistically significant. (N) The expression correlation of hsa-miR-363-3p and RPS26P15 in ovarian cancer. (O) The expression correlation of hsa-miR-363-3p and AC004057.1 in ovarian cancer. (P) The expression correlation of hsa-miR-363-3p and RPS26P31 in ovarian cancer. (Q) The expression correlation of hsa-miR-363-3p and RPS26P6 in ovarian cancer. (R) The expression correlation of hsa-miR-363-3p and RPS26P3 in ovarian cancer. (S) The expression correlation of hsa-miR-363-3p and RPS26P47 in ovarian cancer.