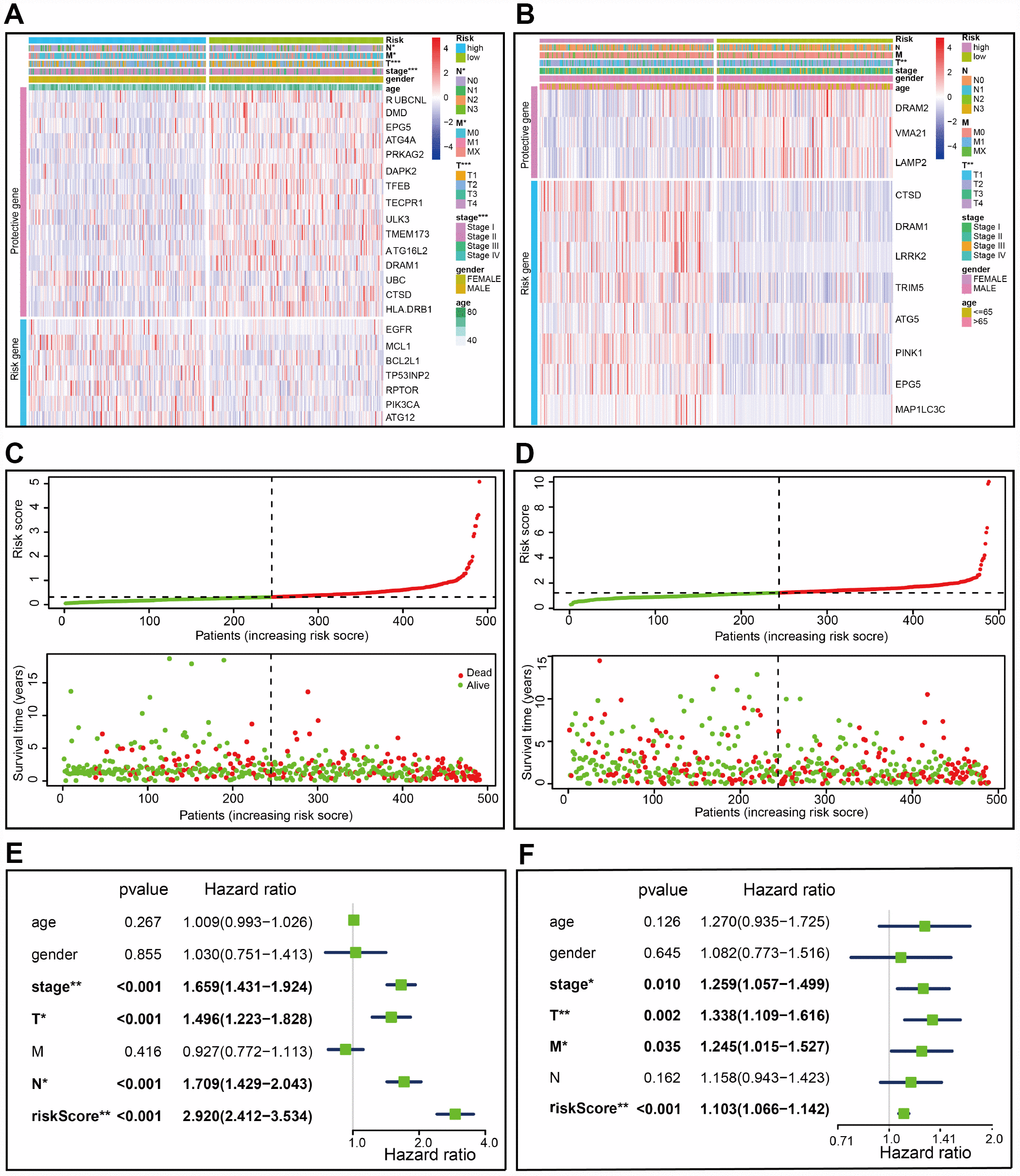
Figure 3.Characteristics of the prognostic gene signature. (A–B) Heatmap of the autophagy-associated gene expression profiles in prognostic signature for TCGA-LUAD (A) and TCGA-LUSC (B). (C–D) The distribution of risk score and patient’s survival time, as well as status for TCGA-LUAD (C) and TCGA-LUSC (D). (C) The black dotted line is the optimum cutoff dividing patients into low risk and high risk groups. (E–F) Univariate Cox regression analysis. Forest plot of the association between risk factors and survival of TCGA-LUAD (E) or TCGA- LUSC (F).