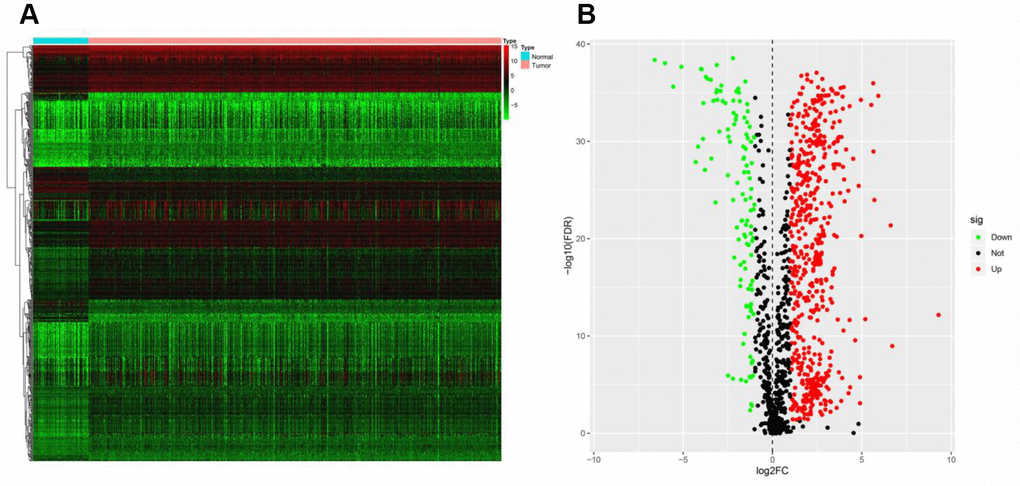
Figure 1.Expression of IRGs in the two sample groups. (A) Heat map of IRGs; the green to red spectrum indicates low to high gene expression. (B) Volcano plot of IRGs; the green dots represent downregulated IRGs, the red dots represent upregulated IRGs and the black dots represent IRGs that were not significantly differentially expressed.