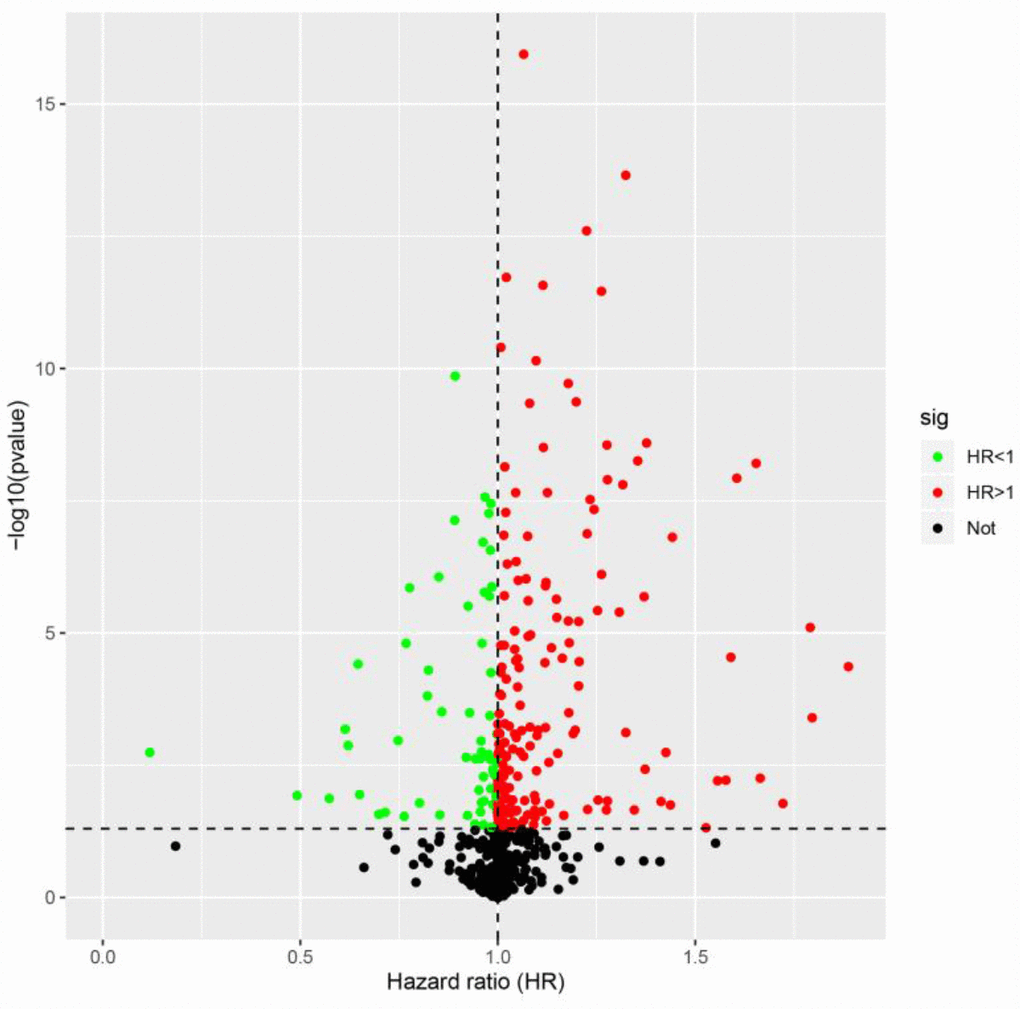
Figure 2.Identification of PDEIRGs through univariate Cox regression analysis. The red dots represent DEIRGs with hazard ratios > 1 (p < 0.05), the green dots represent DEIRGs with hazard ratios < 1 (p < 0.05) and the black dots represent DEIRGs that were not associated with prognosis (p > 0.05).