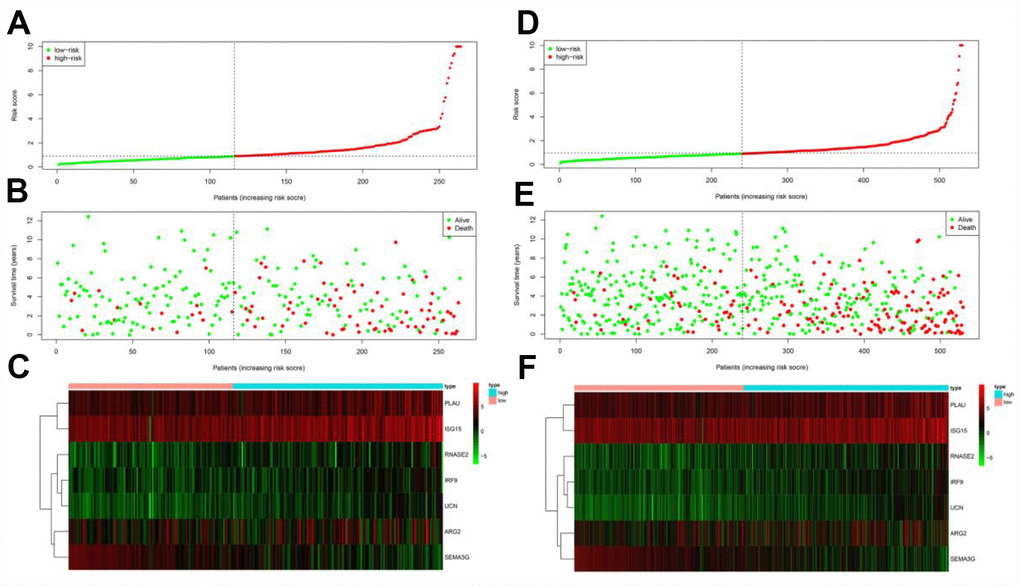
Figure 8.Prognostic analyses of high-risk and low-risk patients in the testing cohort and the entire TCGA cohort. (A) Risk score distribution of patients in the testing cohort. (B) Survival status scatter plots of patients in the testing cohort. (C) Expression patterns of risk genes in the testing cohort. (D) Risk score distribution of patients in the entire TCGA cohort. (E) Survival status scatter plots of patients in the entire TCGA cohort. (F) Expression patterns of risk genes in the entire TCGA cohort.