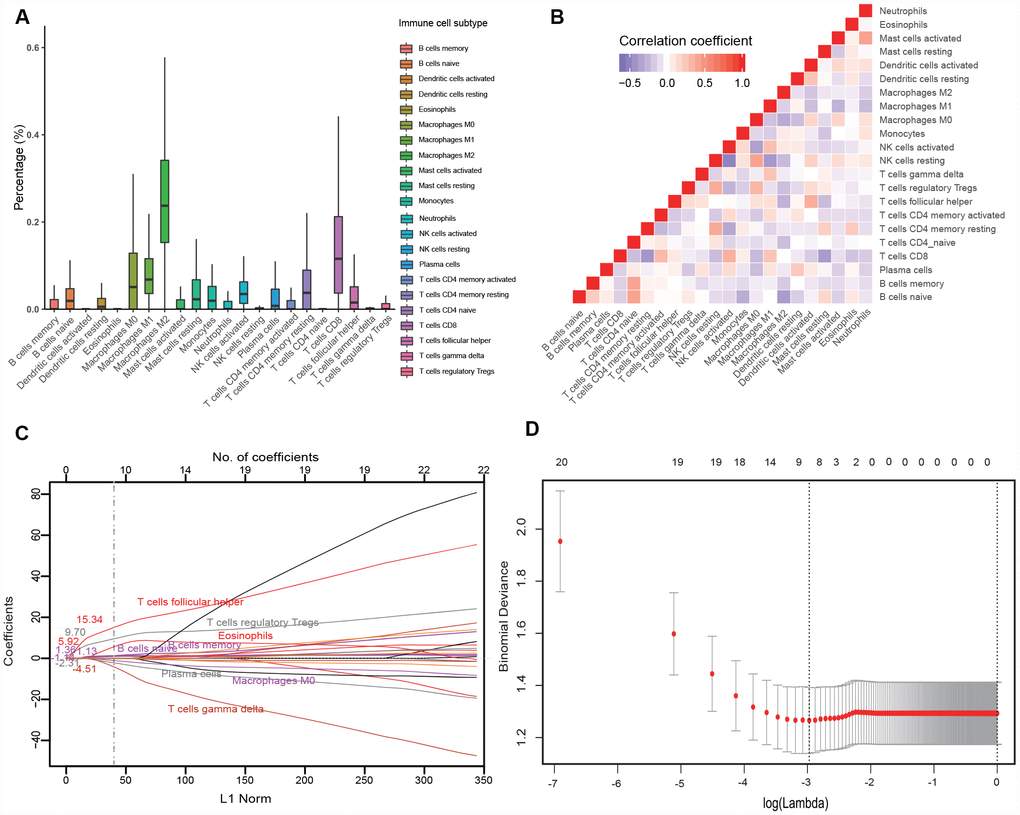
Figure 1.Construction of the immunoscore model. (A) Bar charts summarizing the fractions of 22 immune cell subsets of 134 melanoma tissues before anti-PD1 therapy. (B) Hierarchical clustering shows the collinearity of 22 immune cell subsets in the training cohort, where each cell indicates the Pearson correlation between the row and column corresponding immune cell subsets. The legend characterizes the color change corresponding to the change of correlation coefficient from -0.65 to 1.0. (C) LASSO coefficient of the 22 immune cell subsets. Each curve corresponds to an immune cell subset; the dotted line indicates the value of λ chosen by 200-fold cross-validation via min criteria. (D) 200-fold cross-validation for variable selection in the LASSO regression. PD1, programmed death 1; LASSO, least absolute shrinkage and selection operator.