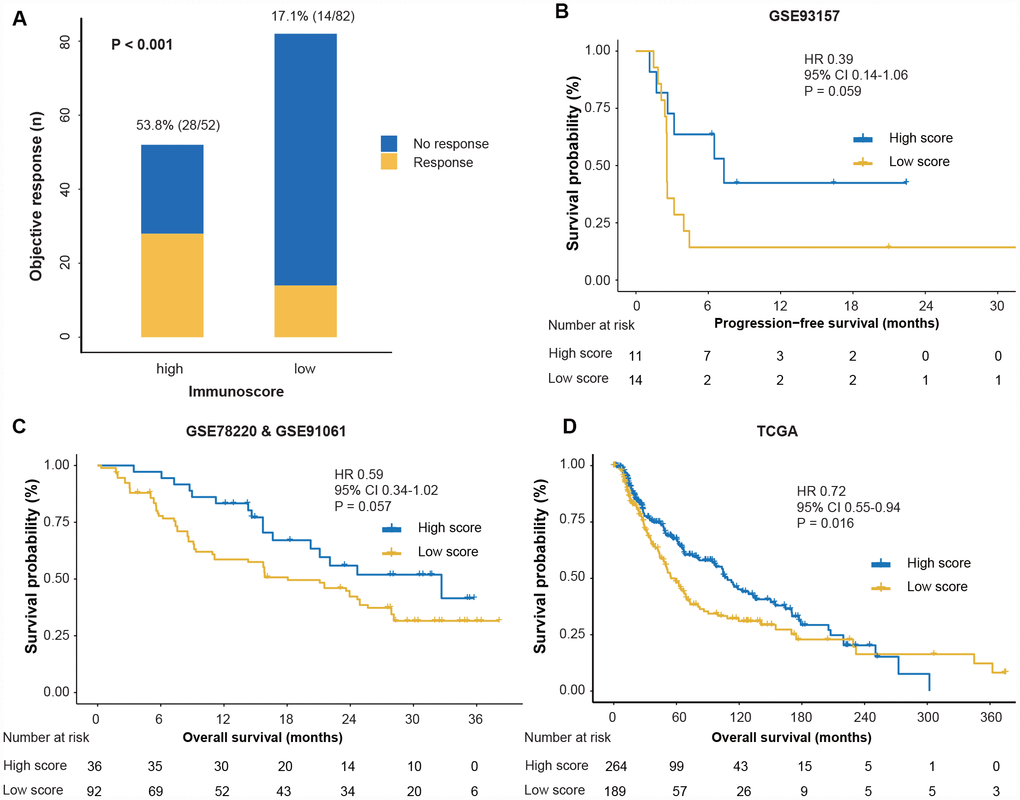
Figure 3.Response and survival outcomes between high- and low-immunoscore groups. (A) Objective response rate between high- and low-immunoscore groups across the pre-anti-PD1 melanoma datasets. “Pre” indicates the biopsy before anti-PD1 therapy. We calculated the P-value with the χ2 test. (B) Comparison of PFS between high- and low-immunoscore groups in the GSE93157 dataset. (C) Comparison of the OS between high- and low-immunoscore groups in the GSE78220 and GSE91061 datasets. (D) Comparison of the OS between high- and low-immunoscore groups in the TCGA dataset. Hazard ratios (HR) and P-values were calculated using the Cox regression analysis and log-rank test; all statistical tests were two-sided. PD1, programmed death-1; OS, overall survival; PFS, progression-free survival; TCGA, The Cancer Genome Atlas.