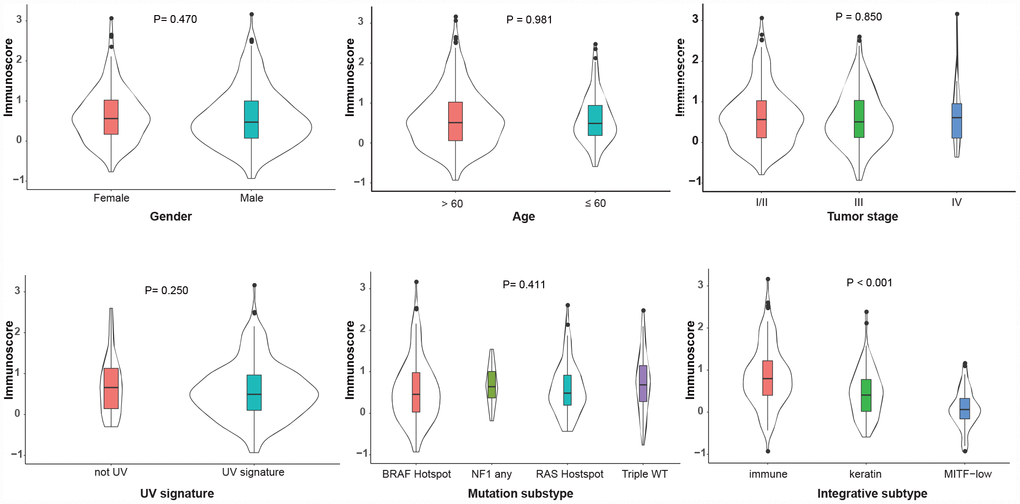
Figure 4.Distribution of the immunoscore in different clinicopathological characteristics in the TCGA dataset. The classifications of the UV signature, mutation subtype and integrative subtype are described by the TCGA genomic classification program [18]. The box plots inside the violin indicate the median value and interquartile range of immunoscore. We calculated the P-values using one-way ANOVA. UV, ultraviolet; TCGA, The Cancer Genome Atlas.