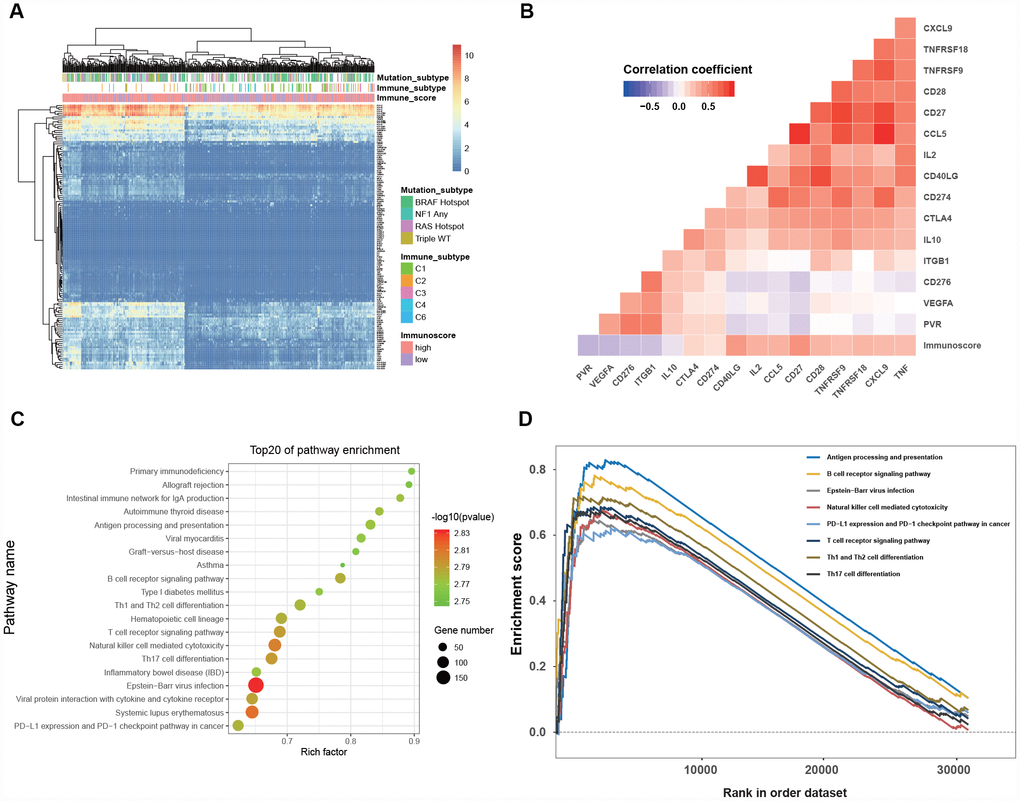
Figure 6.Clinical significance and biological function of the immunoscore. (A) Hierarchical clustering of 138 immune-related gene in 468 melanoma patients from the TCGA dataset. (B) Correlation matrix of immunoscore and the expression of certain immune-related genes. The color of each cell indicates the value of the corresponding Pearson correlation coefficients. (C) Bubble plot of the top 20 biological pathways and processes enriched in the high-immunoscore group using the gene set of “c2.cp.kegg.v6.1.symbols”. The legend shows the values of gene number and -log 10- transformed P-values; all P-values < 0.001. (D)Gene set enrichment analysis reveals the 8 antitumor immune pathways enriched in the high-immunoscore group.