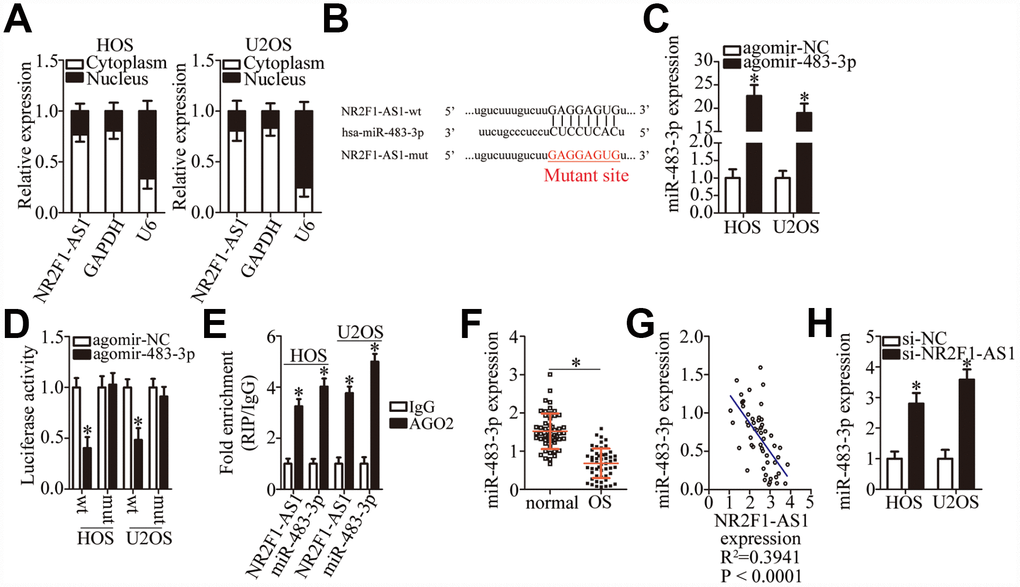
Figure 3.MiR-483-3p is a target of NR2F1-AS1 in OS cells. (A) Nuclear/cytoplasmic fractionation analysis of NR2F1-AS1 expression in HOS and U2OS cells. (B) A diagram of the wild-type and mutant binding sites for miR-483-3p in NR2F1-AS1. (C) RT-qPCR analysis was performed to determine miR-483-3p expression in HOS and U2OS cells that were transfected with either agomir-483-3p or agomir-NC. *P < 0.05 vs. group agomir-NC. (D) Either NR2F1-AS1-wt or NR2F1-AS1-mut was cotransfected with either agomir-483-3p or agomir-NC into HOS and U2OS cells. The luciferase reporter assay was performed at 48 h post-transfection to measure luciferase activity. *P < 0.05 vs. the agomir-NC group. (E) The RIP assay was conducted to evaluate the direct interaction between agomir-483-3p and NR2F1-AS1. Agomir-483-3p and NR2F1-AS1 were both immunoprecipitated by the anti-AGO2 antibody from the lysates of HOS and U2OS cells. *P < 0.05 vs. the IgG group. (F) RT-qPCR was carried out to determine miR-483-3p expression in the 53 pairs of OS tissue samples and the adjacent normal tissues. *P < 0.05 vs. adjacent normal tissues. (G) The correlation between miR-483-3p and NR2F1-AS1 expression levels among the 53 OS tissue samples was determined via Spearman’s correlation analysis. R2 = 0.3941, P < 0.0001. (H) The expression of miR-483-3p in HOS and U2OS cells transfected with either si-NR2F1-AS1 or si-NC was measured by RT-qPCR. *P < 0.05 vs. group si-NC.