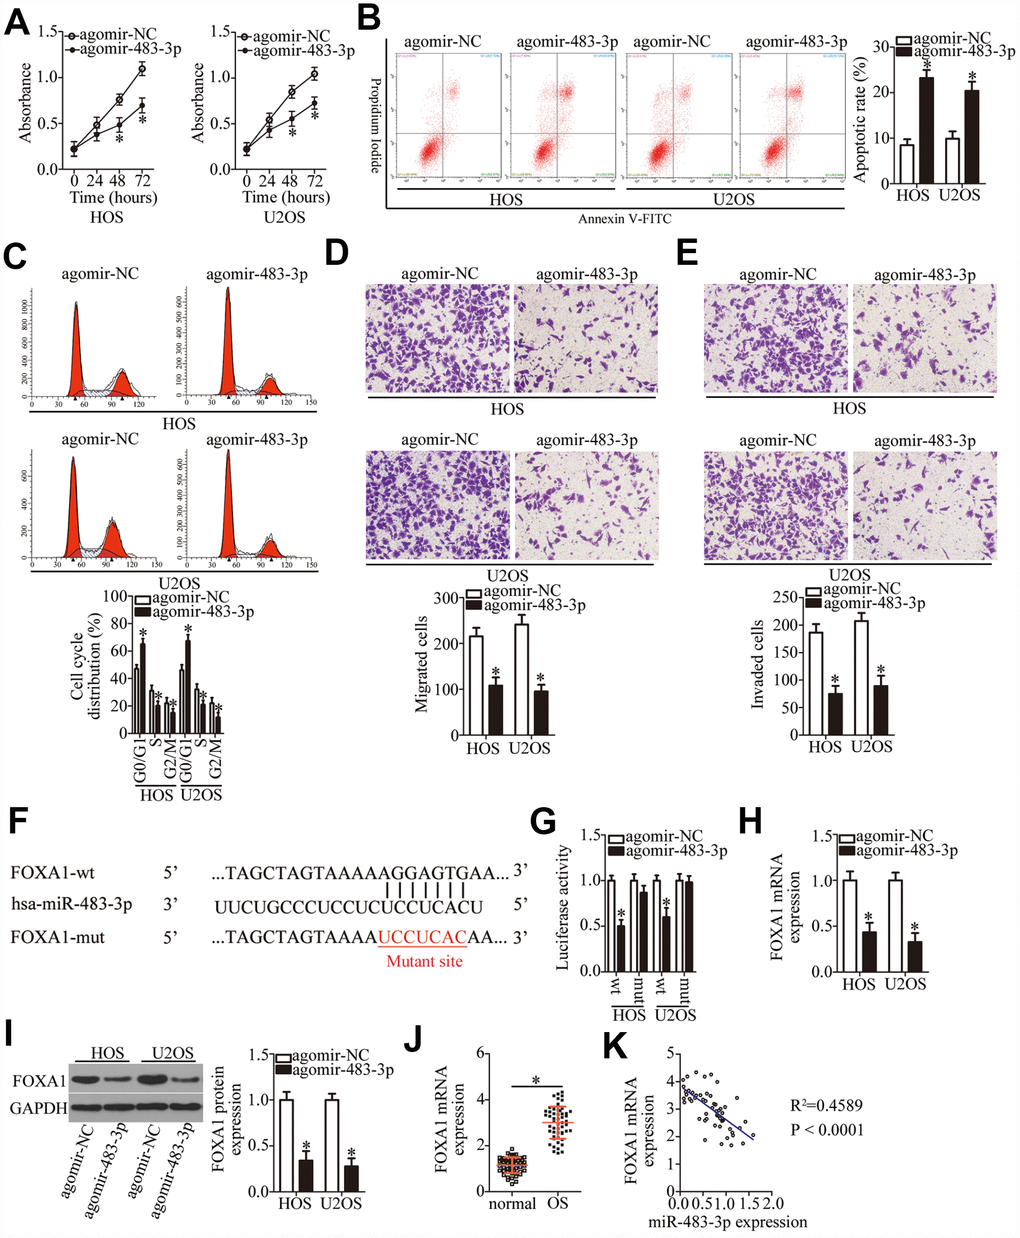
Figure 4.MiR-483-3p directly targets FOXA1 mRNA and plays tumor-suppressive roles in OS cells. HOS and U2OS cells were transfected with either agomir-483-3p or agomir-NC. The transfected cells were studied in functional experiments. (A) The proliferative ability of miR-483-3p–overexpressing HOS and U2OS cells was tested by the CCK-8 assay. *P < 0.05 vs. the agomir-NC group. (B, C) The apoptosis rate and cell cycle status of HOS and U2OS cells were determined via flow-cytometric analysis after either agomir-483-3p or agomir-NC transfection. *P < 0.05 vs. the agomir-NC group. (D, E) Transwell migration and invasion assays were used to assess the impact of miR-483-3p overexpression on the migration and invasiveness of HOS and U2OS cells. *P < 0.05 vs. the agomir-NC group. (F) The predicted miR-483-3p–binding site in the 3′-UTR of the FOXA1 mRNA. The mutated binding sequence is also shown. (G) Either FOXA1-wt or FOXA1-mut along with either agomir-483-3p or agomir-NC was introduced into HOS and U2OS cells. After 48 h of transfection, firefly luciferase activity was measured and normalized to that of Renilla luciferase. *P < 0.05 vs. the agomir-NC group. (H, I) The mRNA and protein levels of FOXA1 in HOS and U2OS cells that were transfected with either agomir-483-3p or agomir-NC were respectively examined by RT-qPCR and western blotting. *P < 0.05 vs. the agomir-NC group. (J) The expression of FOXA1 mRNA in the 53 pairs of OS tissue samples and the adjacent normal tissues was tested via RT-qPCR analysis. *P < 0.05 vs. adjacent normal tissues. (K) The expression correlation between miR-483-3p and FOXA1 mRNA in the 53 OS tissues was analyzed through Spearman’s correlation analysis. R2 = 0.4589, P < 0.0001.