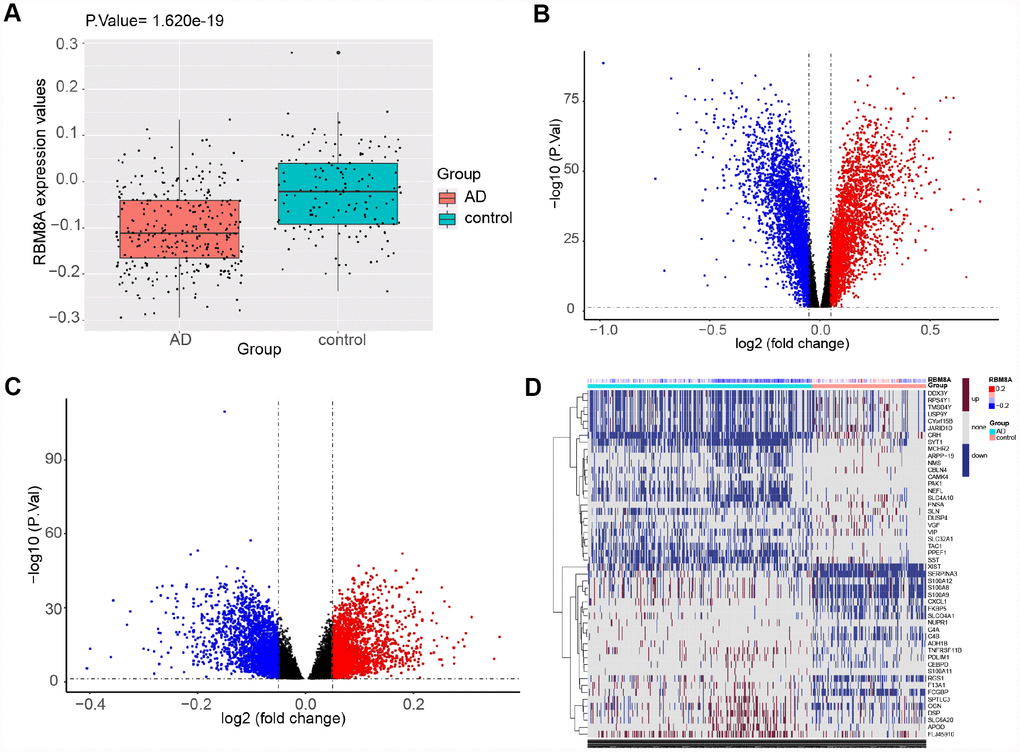
Figure 2.Differential expression gene analysis. (A) RBM8A is down-regulated in AD (P= 1.620e−19, 310 AD patients and 157 normal people's postmortem prefrontal cortex samples are contained). (B) Volcano plot of the AD-control, red represents up-regulated genes, blue represents down-regulated genes, and black represents no significantly differentially expressed genes. (C) Volcano plot of the RBM8A-low/high, blue represents down-regulated genes, and black represents no significantly differentially expressed genes. (D) A heatmap of 25 most up-regulated and 25 most down-regulated genes.