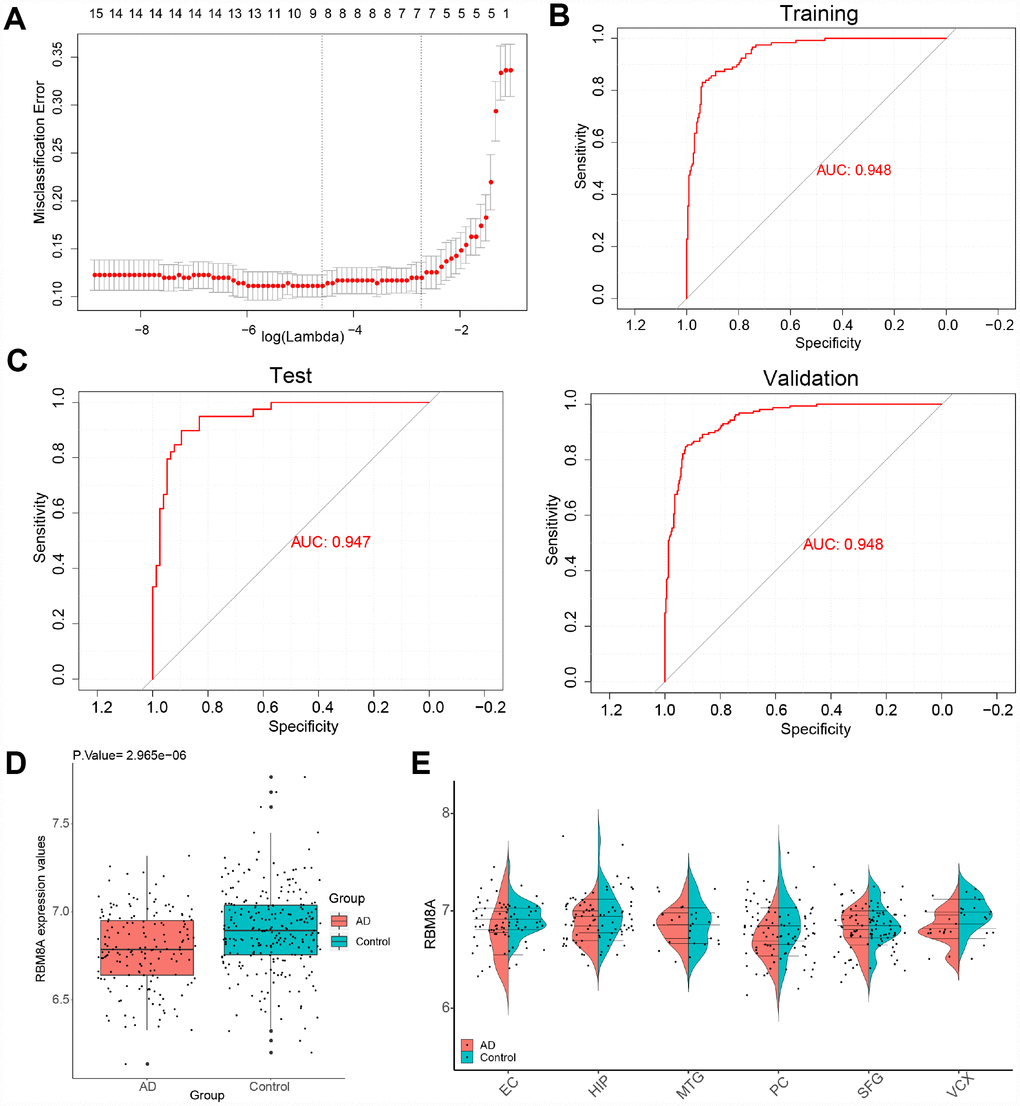
Figure 5.A model for predicting AD and verification of differential expression of RBM8A. (A) LASSO model. (B) ROC curves analysis of train set (GSE33000). (C) ROC curves analysis of test set (GSE3300) and validation (GSE5281 and GSE48350) (D) RBM8A is down-regulated in AD (P= 2.965e-06, 157 AD patients and 247 normal samples are contained). (E) RBM8A is down-regulated in various brain regions. EC: entorhinal cortex, HIP: hippocampus, MTG: medial temporal gyrus, PC: posterior cingulate, SFG: superior frontal gyrus, VCX: primary visual cortex.