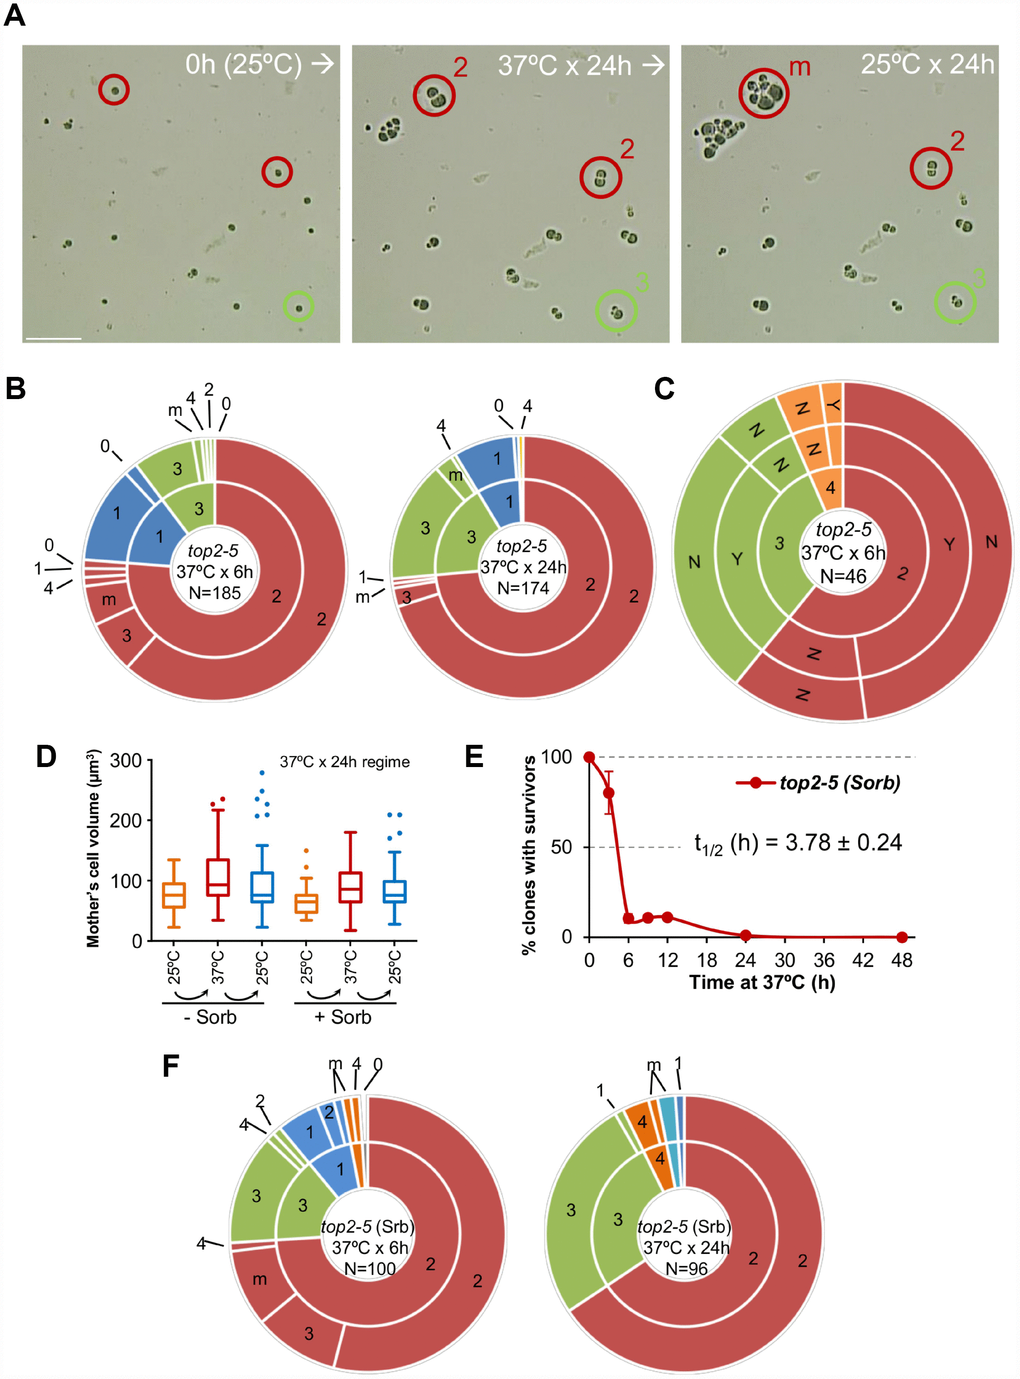
Figure 2.Most daughter cells coming from a Top2-mediated mitotic catastrophe are unable to divide again. (A) Haploid top2-5 cells were spread at high cell density on two Petri dishes. At the time of seeding, 0h (25 °C), several fields were photomicrographed before incubating the plates at 37 °C during either 6 h or 24 h. After the 37 °C incubations, the same fields were localized, photomicrographed again, and further incubated 16-24 h at 25 °C. An example of a microscope field of a 37 °C x 24 h experiment. Three representative unbudded cells at 0h (25 °C) are highlighted. In red, two cells that budded just once during the 37 °C x 24 h incubation (“2” cell bodies); one of them able to re-bud again a few times after the 25 °C downshift (“m”) and the second one that remained stuck as “2”. In green, a cell that reached “3” bodies at 37° C and remained so after the final 25 °C x 24 h incubation. Scale bar corresponds to 50 μm. (B) Analysis of how far the top2-5 MC progeny can go based on the microcolony approach shown in panel A. Only unbudded (G1/G0) cells at 0h (25 °C) were considered. The inner circle in the sunburst chart depicts proportions of cell bodies after the 37 °C incubation. The outer circle depicts the situation after the final 25 °C incubations (see supplemental information for a detailed description). On the left are results from a 37 °C x 6 h regime; on the right are results from a 37 °C x 24 h regime. Numbers point to the number of cell bodies; “m” means microcolonies of 5 or more bodies. (C) Capability of the top2-5 progeny to split apart and relationship with overall survivability. Unbudded cells were micromanipulated and arranged at defined plate positions before incubating them for 6 h at 37 °C. Then, those cells able to re-bud at least once were subjected to an attempt to physically separate the cell bodies. The inner circle in the sunburst depicts the number of cell bodies after the 37 °C incubation. The middle circle depicts the result of the separation attempt (“Y” or “N”, successful or unsuccessful, respectively). The outer circle indicates if any of the bodies was able to raise a macrocolony (Yes or No) after 4 d incubation at 25 °C. (D) Progression of the size (volume) of the original G1/G0 cells (mother) after the top2-5 mitotic catastrophe with and without the osmotic stabilizer Sorbitol (Sorb, 1.2 M). (E) Time course of clonogenic survivability in the presence of 1.2 M Sorbitol. The experiment was conducted as in Figure 1D. (F) Sunbursts of microcolony analyses in the presence of 1.2 M Sorbitol (Srb) at the 6 h and 24 h x 37 °C regimes. Interpretation as in panel B. In sunburst charts, N indicates number of original unbudded cells which were followed; blue sectors depict G1/G0 cells that remained unbudded during the 37 °C incubations; red sectors, cells that budded once at 37 °C; green sectors, cells that reached 3 bodies at 37 °C; orange sectors, cells that reached 4 bodies at 37 °C; cyan sectors, cells that reached 5 or more bodies at 37 °C.