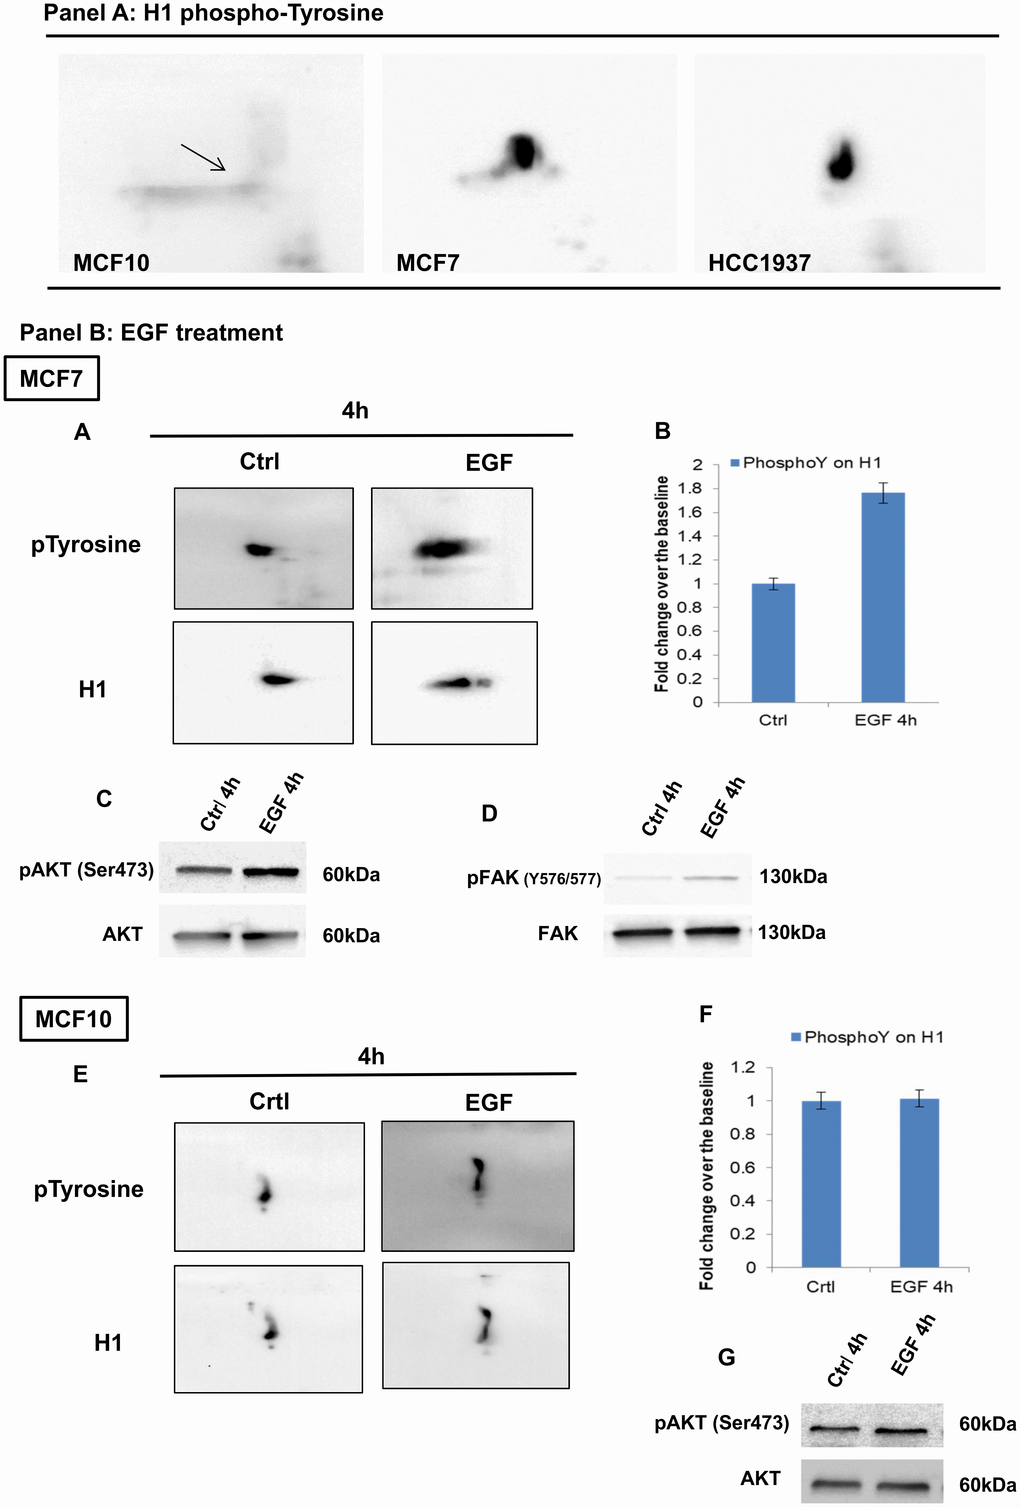
Figure 6.Analysis of H1 histone tyrosine phosphorylation in breast and normal cancer cells, using 2D-TAU western blot. (Panel A) 2D western blots showing tyrosine phosphorylation on the Histone H1 in MCF10, MCF7 and HCC1937 cells. Arrow indicates the region corresponding to the phosphorylated protein. Blot images were acquired using Alliance 2.7 (UVITEC, Eppendorf, Milan, Italy). Membranes signals were acquired concomitantly at 4 seconds. (Panel B) (A) 2D TAU western blot analysis of histone H1 tyrosine phosphorylation on MCF7 cells (acquisition time: 4’’) and (E) MCF10 cells (acquisition time: 20’’) following EGF stimulation. Lower panels indicate the relative normalization with H1 antibody; the relative densitometry analyses are shown in B for MCF7 cells and in F for MCF10 cell lines. The assays were repeated in three independent biological replicates Data are expressed as mean ± SEM (N =3). (C, G): Western blot analysis of pAKT and AKT levels on whole protein extracts from EGF treated MCF7 and MCF10 cells, respectively. (D) Western blot analysis of pFAK (Y576/577) levels on whole protein extracts from EGF treated MCF7.