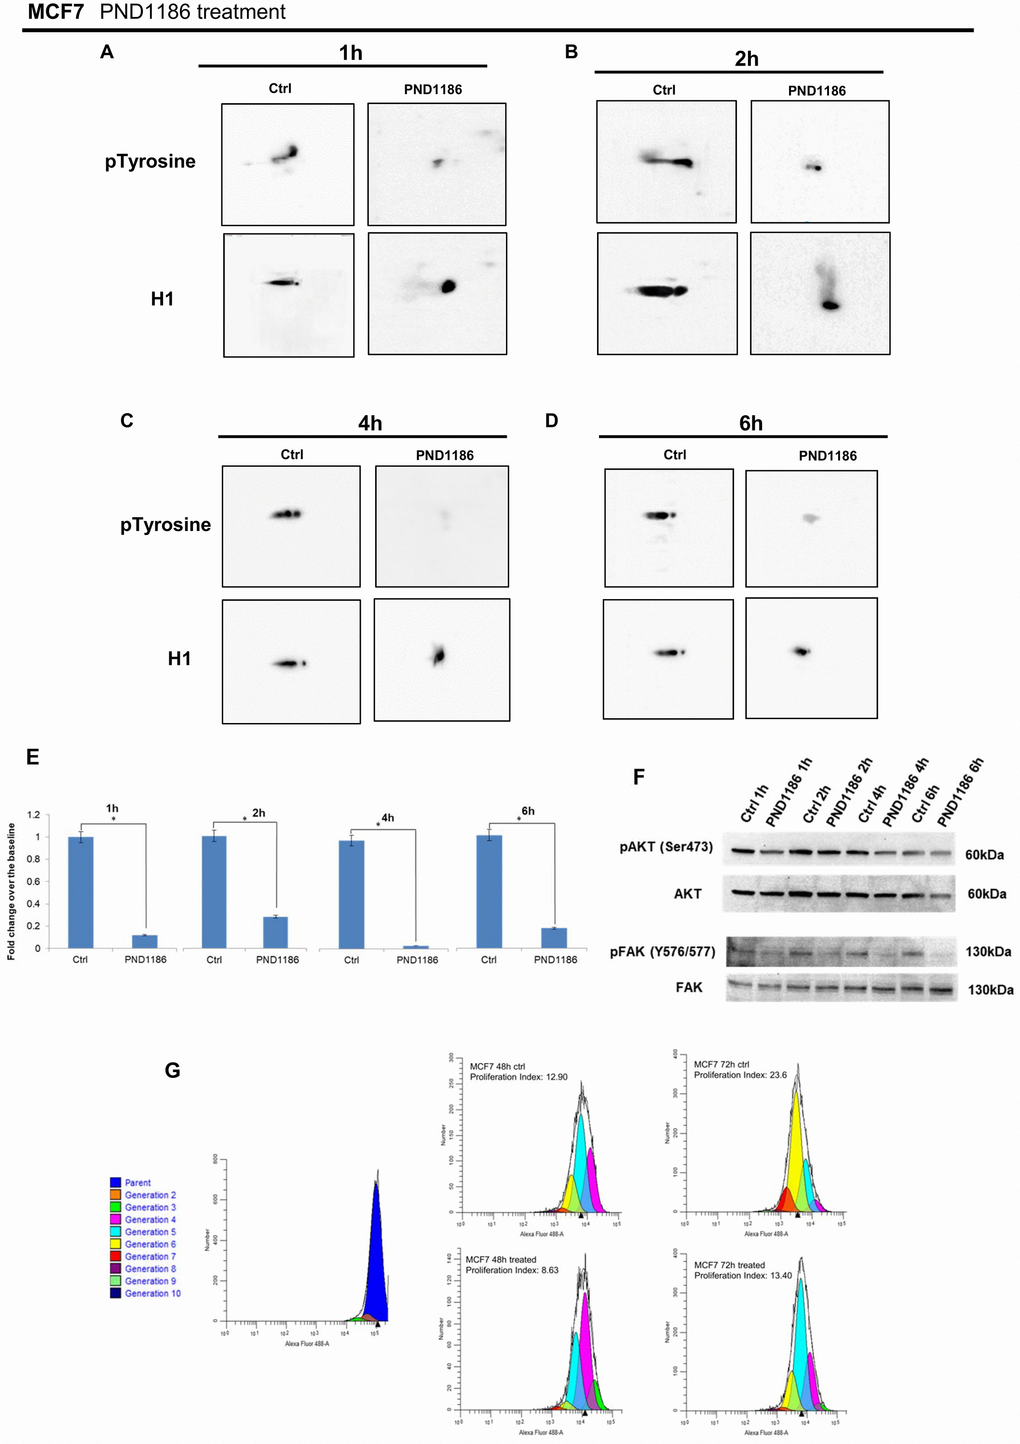
Figure 8.Analysis of H1 histone tyrosine phosphorylation following PND1186 treatments in MCF7 cells. 2D TAU Western blot analysis of histone H1 tyrosine phosphorylation (upper panel) and relative normalization with H1 antibody (lower panel) after PND1186 treatment; a time course of FAK inhibition was done at 1 hour (Panel A), 2 hours (Panel B), 4 hours (Panel C) and 6 hours (Panel D). All WB 2D images were acquired in 4 seconds. (Panel E) Densitometry analysis of H1 tyrosine phosphorylation spots; (panel F) Western blot analysis of pAKT, and pFAK levels in protein extracts from PND1186-treated cells. Phospho-Akt (ser473) and pFAK (Y576/577) signals were normalized against the corresponding total Akt and total FAK respectively. The assays were repeated in three independent biological replicates. Data are expressed as mean ± SEM (N =3), (G) Cells untreated and in presence of PND1186 300nM were cultured for 48 and 72 hours. Proliferation potential was detected, at single cell level, by CellTrace™ CFSE labeling. FACS analysis was performed at T0 (immediately after cell staining to define the parent population) and at 48 and 72 hours. Data were analysed by ModFit LT™ 4.0 software and the proliferation index has been generated for each sample.