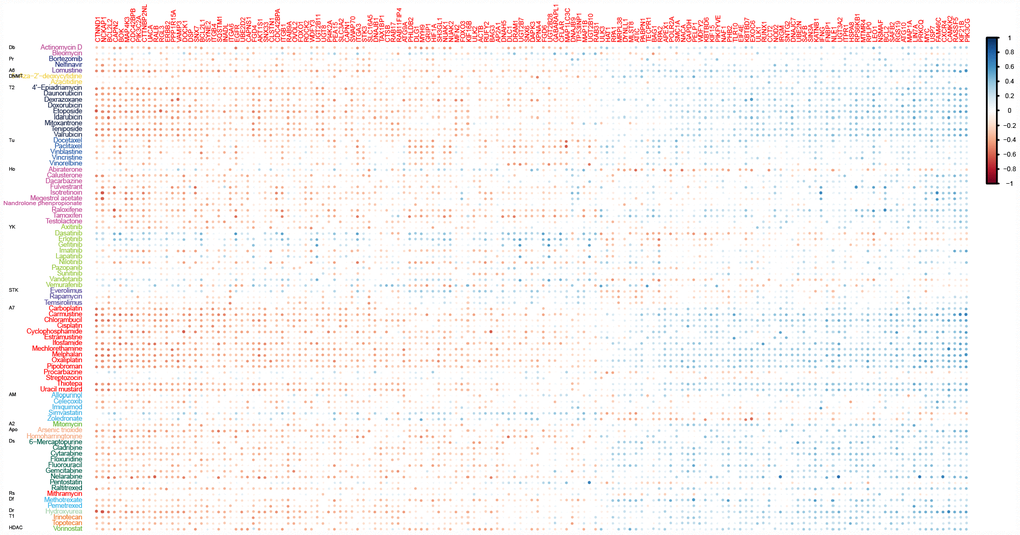
Figure 1.Correlations between drug sensitivity and the expression of ATG genes for at least ten drugs. Color bars indicate the Pearson’s correlation coefficient (PCC) between drugs and ATG genes. Different colors represent drugs with different MOA values. MOA: A2: alkylating at N-2 position of guanine; A6: alkylating at O-6 of guanine; A7: alkylating at N-7 position of guanine; AM: antimetabolite; Apo: apoptosis inducer; Db: DNA binder; Df: antifols (impairs the function of folic acids, which inhibits production of DNA, RNA, and proteins); DNMT: DNA methyltransferase inhibitor; Dr: ribonucleotide reductase inhibitor; Ds: DNA synthesis inhibitor; HDAC: Histone deacetylase; Ho: hormone; Pr: protease/proteasome; Rs: RNA synthesis inhibitor; STK: serine/threonine kinase inhibitor; T1: topoisomerase 1 inhibitor; T2: topoisomerase 2 inhibitor; Tu: tubulin-active antimitotic; YK: tyrosine kinase inhibitor.