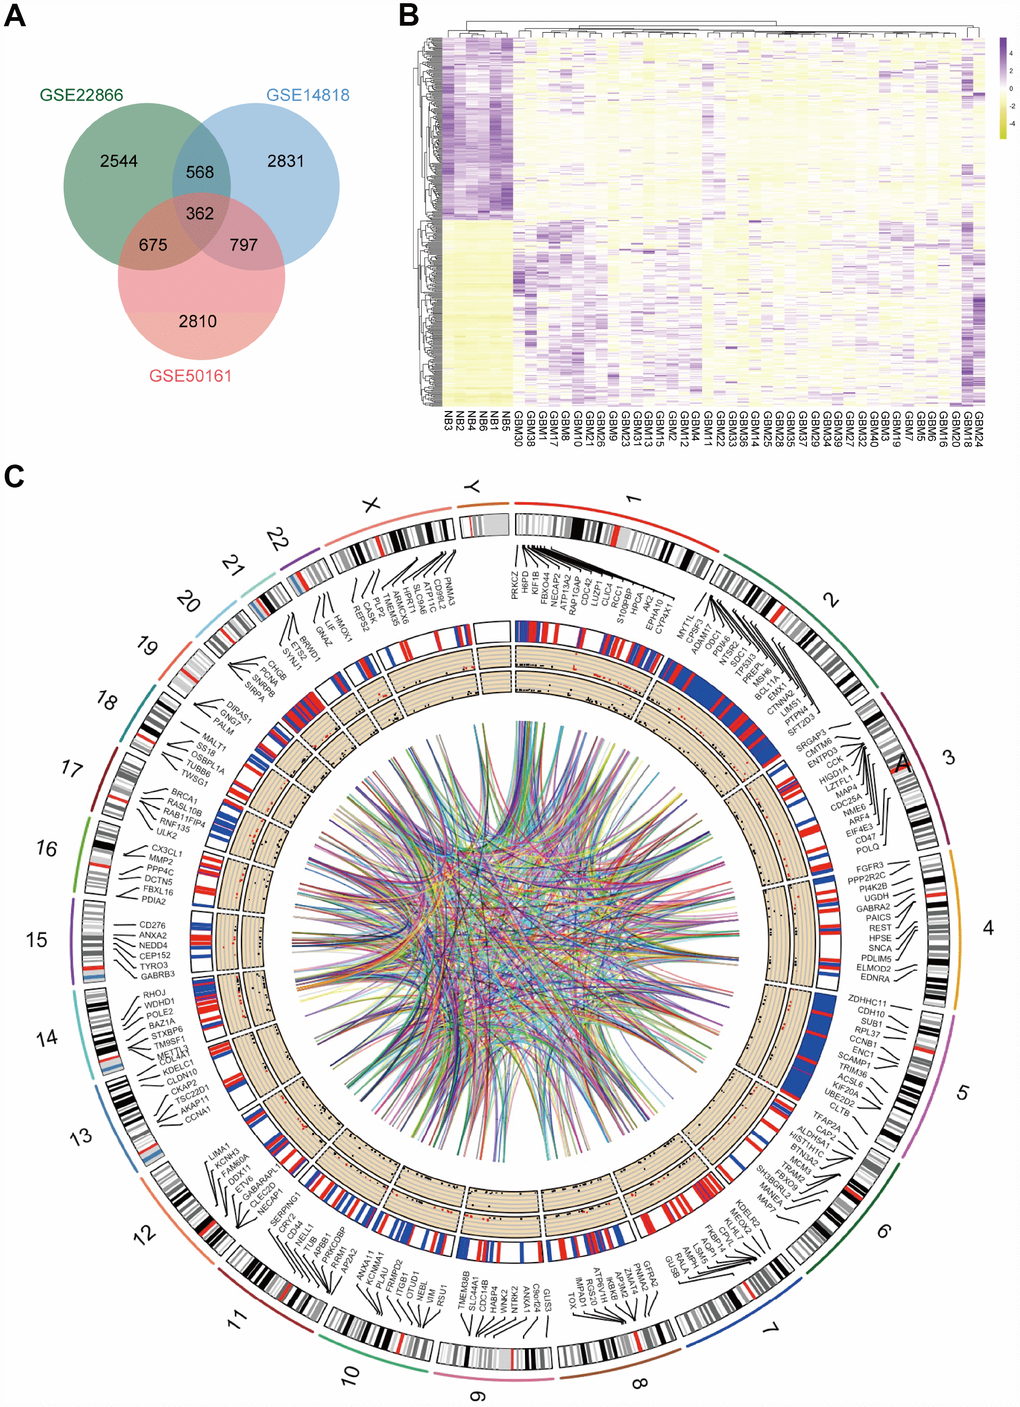
Figure 1.Identification of DEGs in mRNA datasets GSE14818, GSE22866 and GSE50161. (A) Venn diagram presents overlapping relationships, and 362 DEGs were identified. (B) Cluster analysis of DEGs using data profile GSE22866 as a reference. Data are presented as a heat map. (C) Circos plot showing DEGs on human chromosomes. From the outside in, the first layer of the circos plot is a chromosome map of the human genome, black and white bars are chromosome cytobands, and red bars represent centromeres. Due to limited space, some of the DEGs are labelled in the second circle. In the third layer, up- and downregulated DEGs are marked in red and blue, respectively. The fourth layer represents the fold change of DEGs with fold change ≥ 2.0. The innermost circle indicates the DEGs with p-value < 0.05. The network in the centre of the plot represents the core network.