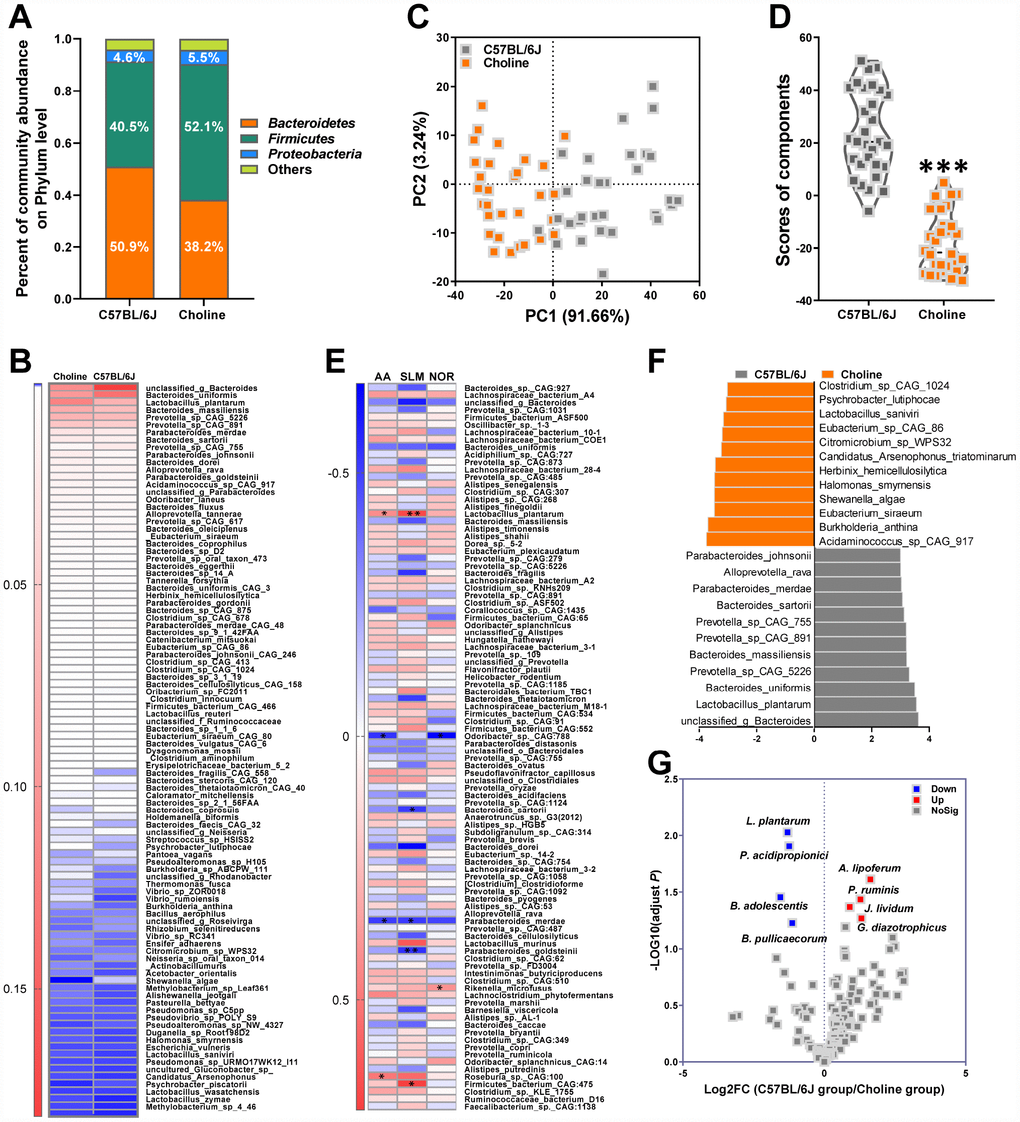
Figure 4.Effects of choline supplementation on microbial remodeling in C57BL/6J mice. Metagenomic analyses of feces at the phylum level (A). Heat map of metagenomic analyses of feces at the species level. The scale reveals the data as follows: red represents high values and blue represents low values for the percentages of reads that were classified at that rank (B). PCA at the species level in each group (C) and average PCA scores (D). ***P<0.001, versus the C57BL/6J mice, by unpaired Student's t-tests. All values are mean ± S.D. n=30. Correlation heat map demonstrating the association between the indicated microbiota taxonomic species and cognitive abilities from mice grouped by dietary status (chow and choline) (E). Red denotes a positive correlation, blue denotes a negative correlation, and white denotes no correlation. A single asterisk indicates a significant FDR-adjusted correlation at P≤0.05, and two asterisks indicate a significant FDR-adjusted correlation at P≤0.01. NOR=novel object recognition memory; SLM=spatial learning and memory; AA=active avoidance. The taxons most differentially abundant between the mice with or without choline at the species level were identified by linear discriminant analysis (LDA) coupled with effect size measurements (F). Choline-diet-enriched taxa are indicated with a negative LDA score (orange), and taxa enriched in the normal chow diet have a positive score (gray). Only taxa meeting an LDA significant threshold value of >3 are displayed. Volcano plots are used to visualize the differential probiotics expression between the mice with or without choline (G). The red points in the plot represent the differentially increased probiotics, the blue points represent the differentially decreased probiotics, the gray points represent the no changed probiotics with statistical significance.