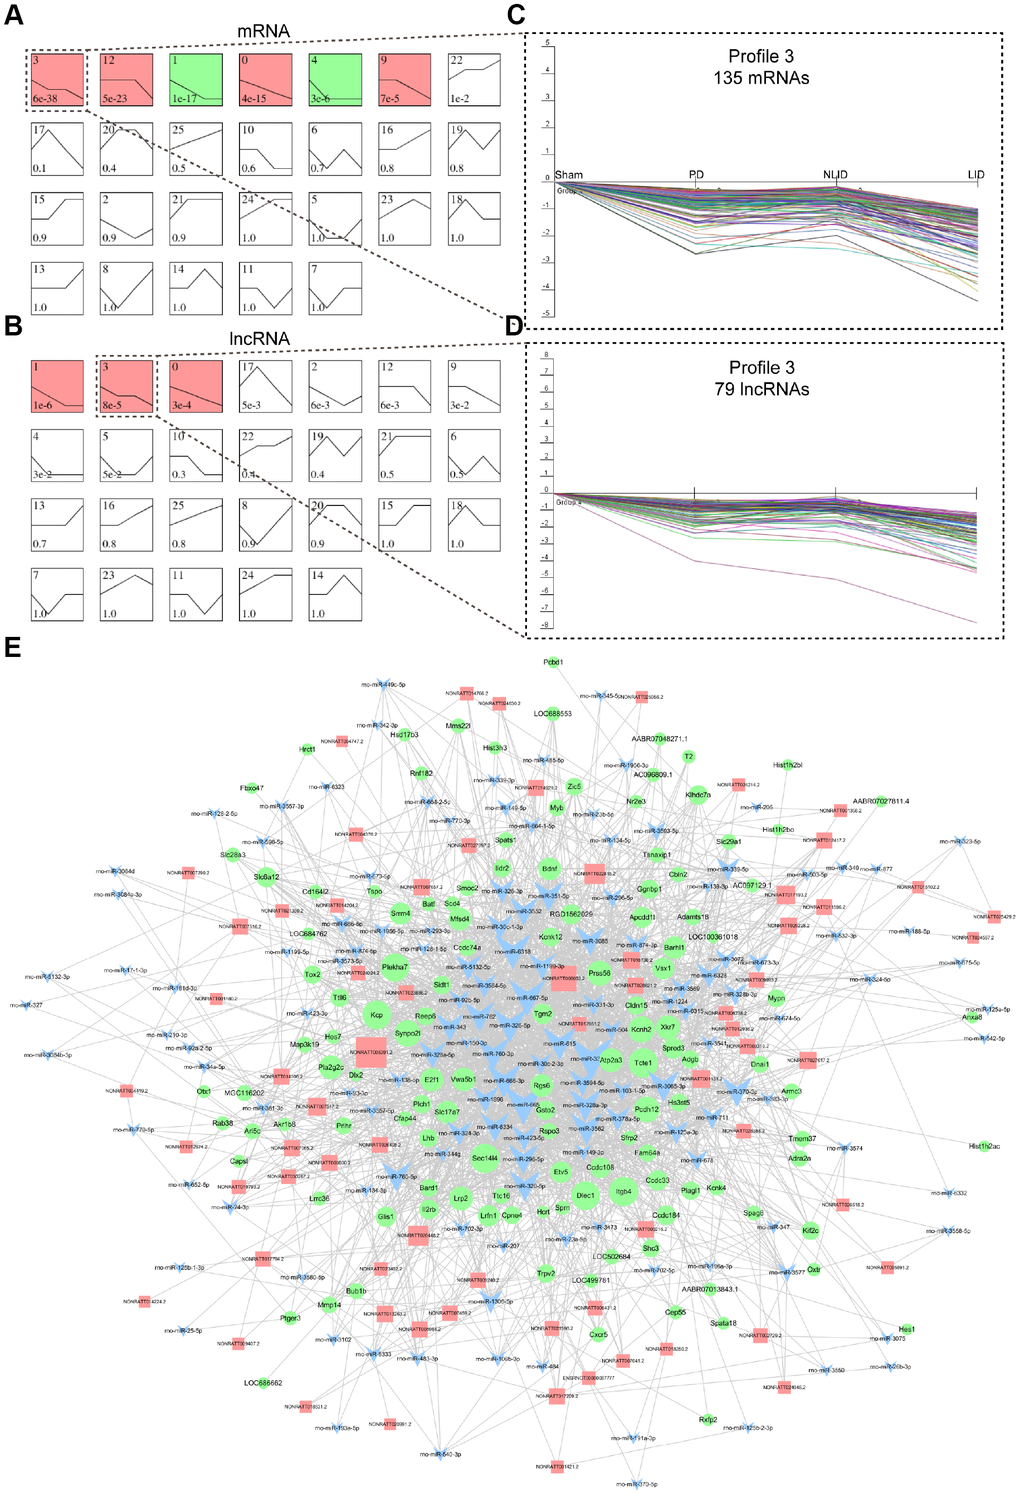
Figure 2.LncRNA and mRNA expression signatures of PD and LID rats. (A, B) Dynamic expression analyses of differentially expressed coding (A) and non-coding (B) genes. Differential expression patterns were determined based on 26 model profiles; each box represents a model expression profile, with the model profile number and P value shown in the box. Expression profiles with significant differences (P < 0.05) are indicated in red or green. (C, D) Profile 3 of mRNAs (C) and lncRNAs (D) in dotted boxes are shown in detail to the right. The horizontal axis shows the four groups (Sham, PD, NLID, and LID) and the vertical axis shows gene expression level. Each curve represents a single gene. (E) ceRNA network of lncRNAs with mRNAs in profile 3. LncRNAs, mRNAs, and miRNAs are represented by red squares, green circles, and blue triangles, respectively.