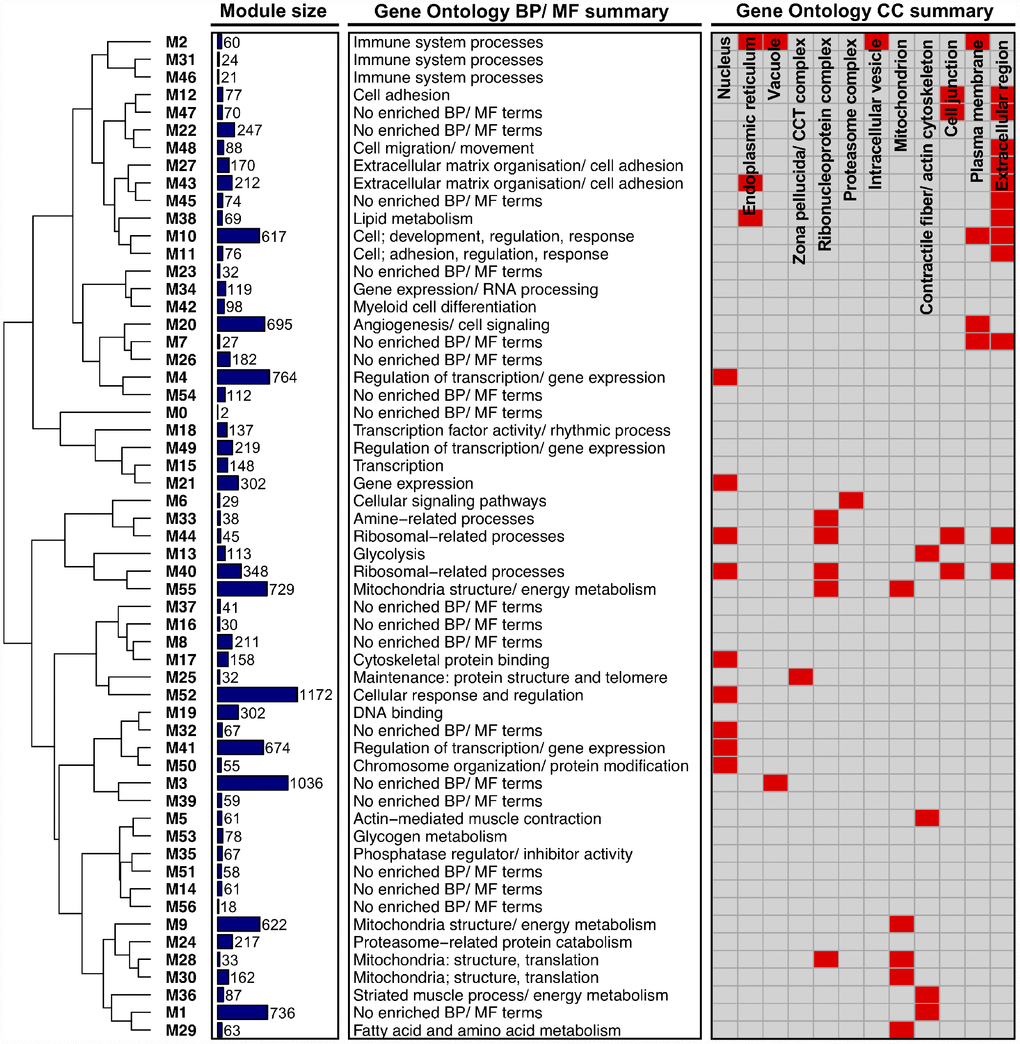
Figure 1.Higher-order functional organisation of the co-expression network. Network modules (labelled ‘Mi’) are hierarchically clustered based on their eigengene correlations (using average linkage and ‘1 – correlation’ as a distance metric). Modules closer together in the dendrogram therefore have a more similar expression profile. Also given is the size of each module (depicted as a bar chart), a summary of each module’s enriched Gene Ontology (GO) Biological Process (BP)/ Molecular Function (MF) terms, and a summary of each module’s GO Cellular Component (CC) terms (provided as a heatmap, where red shading denotes that a module is enriched with GO terms related to a given CC).