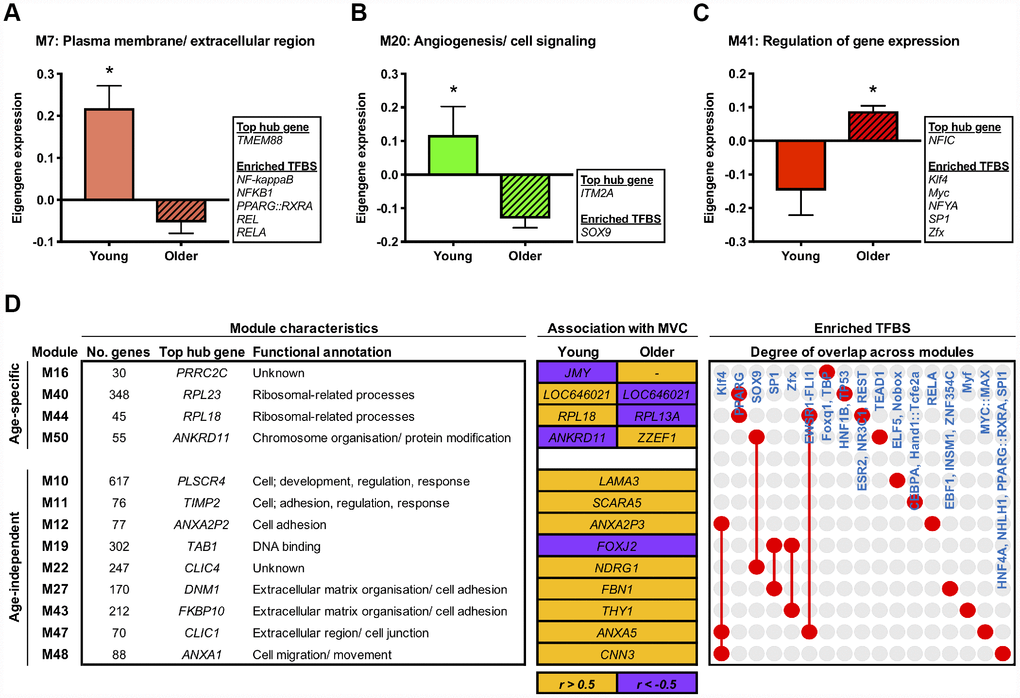
Figure 2.Age-related molecular networks and candidate molecules in resting muscle. Panels (A–C) Network modules displaying a divergent co-expression pattern between ages at baseline. Box inserts show the top ranked hub gene, and all identified enriched transcription factor binding sites (TFBS) for each module. Data are mean ± SEM. *FDR < 5%. Panel (D) Network modules that significantly associate (P < 0.05) with baseline maximal voluntary isometric contraction (MVC) in either an age-dependent or age-independent manner. Orange shading denotes a positive relationship and purple indicates a negative relationship. Also shown is each module’s top ranked hub gene, the hub gene ranked highest among the module genes by gene significance to MVC at baseline (i.e. within the upper quartile of module genes ranked by their gene significance to baseline MVC (shown in orange/ purple shaded boxes)), and enriched TFBS. Red dots/ connecting red lines indicate whether a given TFBS is enriched in the genes of one or more MVC-related module.