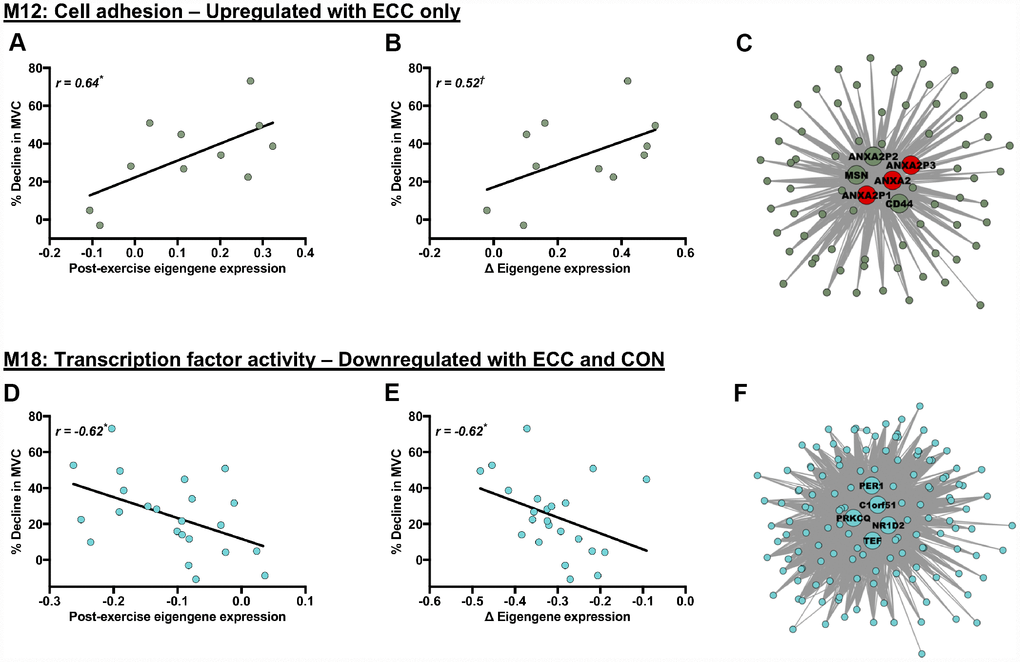
Figure 4.Molecular networks and candidate molecules related to the acute post-exercise muscle functional response. Panels (A, B, D and E) Scatterplots showing relationships between post-exercise declines in MVC (% decline from baseline) and contraction-induced eigengene expression patterns (for exact post-exercise eigengene expression values (A, D) and changes (Δ) in eigengene expression from baseline to post-exercise (B, E)). Panels (C) and (F): corresponding module visualisations for M12 (Panel C) and M18 (Panel F). Of note, larger, annotated nodes in panels (C) and (F) highlight module hub genes: red shading depicts individual hub genes highly linked to the % decline in MVC (i.e. within the upper quartile of module genes ranked by their gene significance to the post-exercise decline in MVC). Module visualisations were generated using Cytoscape (v3.5.1) [56]. *P < 0.05 and †P < 0.1 with |r| > 0.5 in all cases, using Pearson’s or Repeated Measures correlation where appropriate.