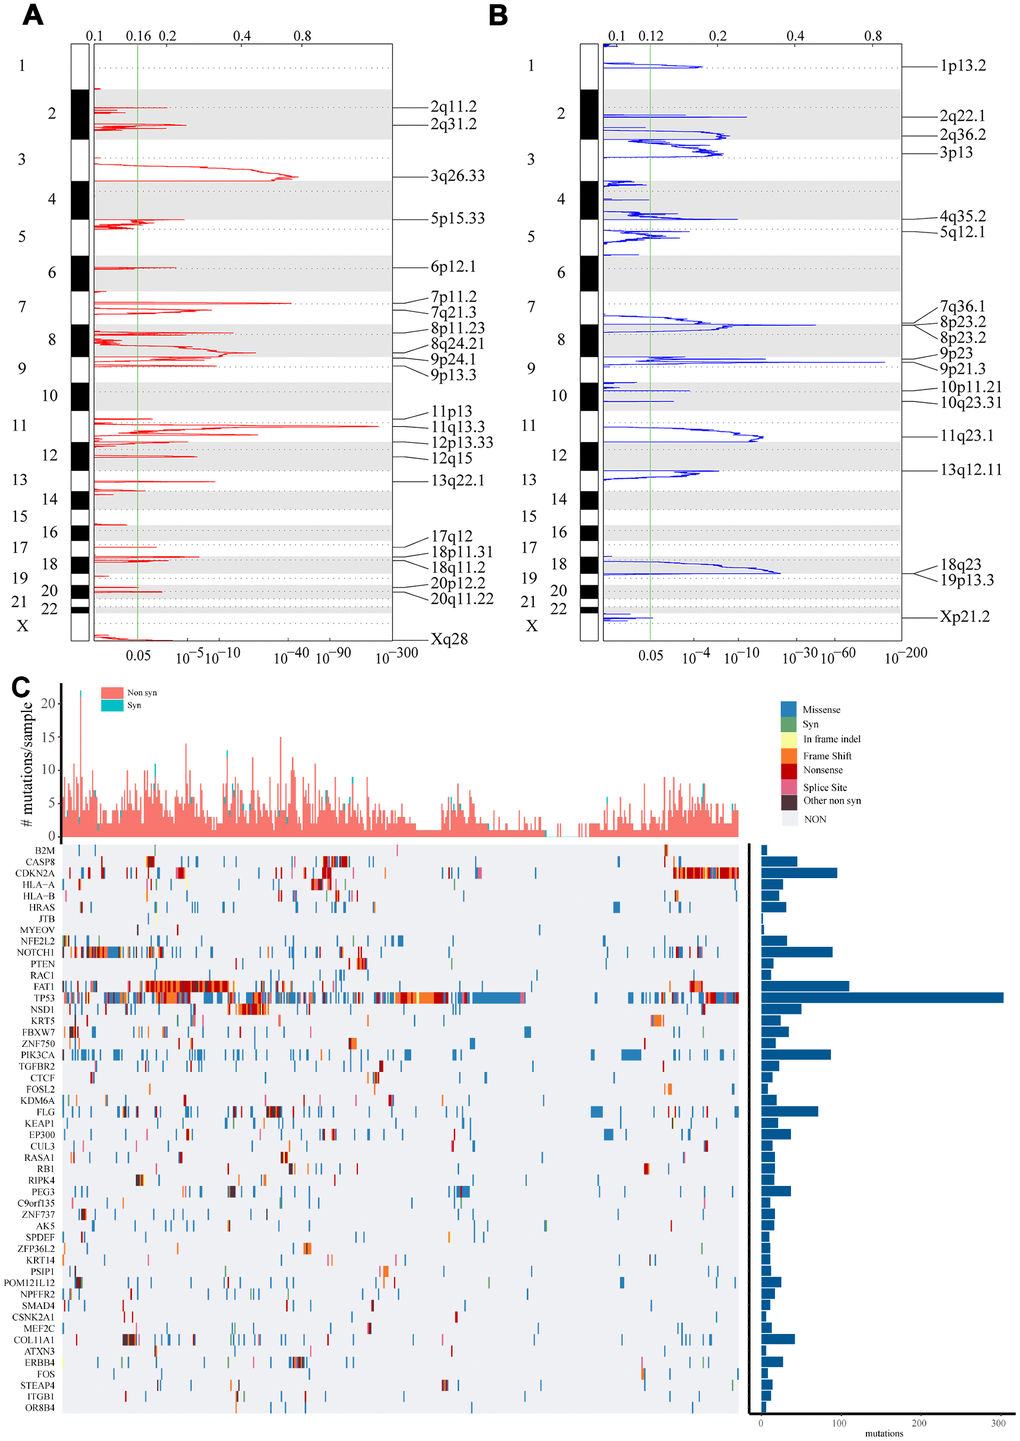
Figure 1.Identification of genes with significant amplification or deletion. (A and B) The mRNA located in the focal CNA peaks are HNSCC-related. False-discovery rates (q values) and scores from GISTIC 2.0 for alterations (x-axis) are plotted against genome positions (y-axis). Dotted lines indicate the centromeres. Amplifications (A) are shown in red, deletion (B) in blue. The green line represents 0.25 q value cut-off point that determines significance. (C) Top 50 genes with the most significant mutations. The bar chart above shows the total number of synonymous and non-synonymous mutations in each patient's top 50 genes. The bar chart on the right shows the number of samples in which the 50 genes were mutated in all samples. The different colors in the thermogram indicate the type of mutation; gray indicates no mutation.