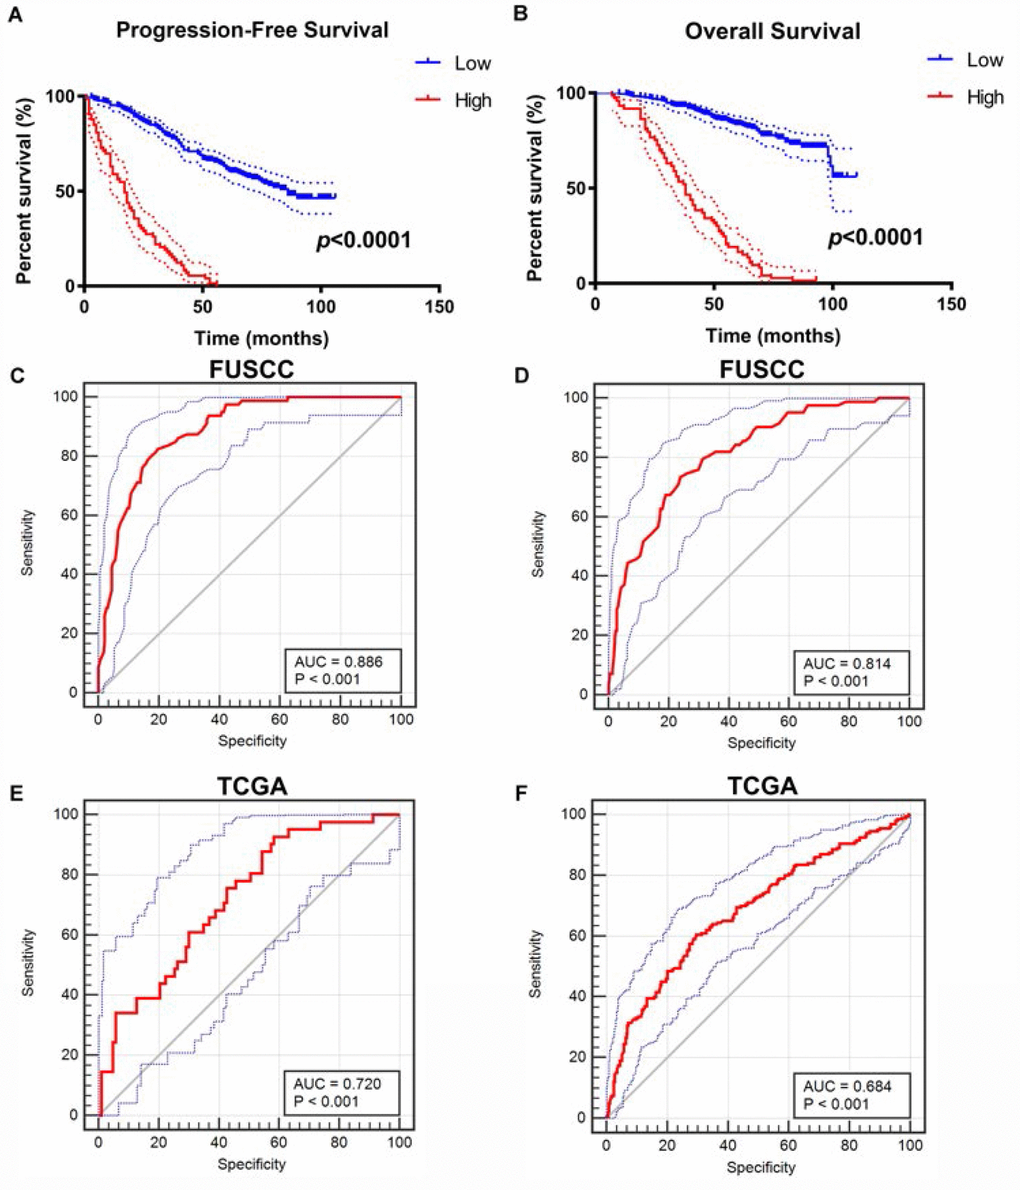
Figure 4.Construction and internal validation of integrated prognostic and diagnostic model. All significant clinicopathologic parameters and gene expression profiles was integrated in the Cox regression models, which indicated this formula: = -0.708×CDH1 expression (ref. Low) + 1.360×SNAI1 expression (ref. Low) + 1.905×VIM expression (ref. Low) + 2.179×TWIST1 expression (ref. Low) + 1.274×T stage (ref. T1-T2) + 1.919×M stage (ref. M0) + 2.021×AJCC stage (ref. I-II) + 2.013×ISUP grade (ref. 1-2) for PFS (A), and another formula: = -0.564×CDH1 expression (ref. Low) + 1.532×SNAI1 expression (ref. Low) + 1.804×VIM expression (ref. Low) + 1.714×TWIST1 expression (ref. Low) + 1.226×T stage (ref. T1-T2) + 1.778×M stage (ref. M0) + 2.515×AJCC stage (ref. I-II) + 1.954×ISUP grade (ref. 1-2) for OS (B). The Kaplan–Meier method was used to determine the significant survival outcomes (PFS: p<0.0001; OS: p<0.0001). ROC curves were generated to validate the ability of the logistic model to predict prognosis. The AUC index for the integrated model were 0.886 for PFS (p<0.001) (C) and 0.814 for OS (p<0.001) (D). (E, F) External validation of integrated model using TCGA cohorts. ROC curves were constructed to perform external validation using clinicopathological parameters and mRNA expression profiles from TCGA cohort. The AUC index for the integrated model were 0.720 for PFS (p<0.001) (E) and 0.684 for OS (p<0.001) (F).