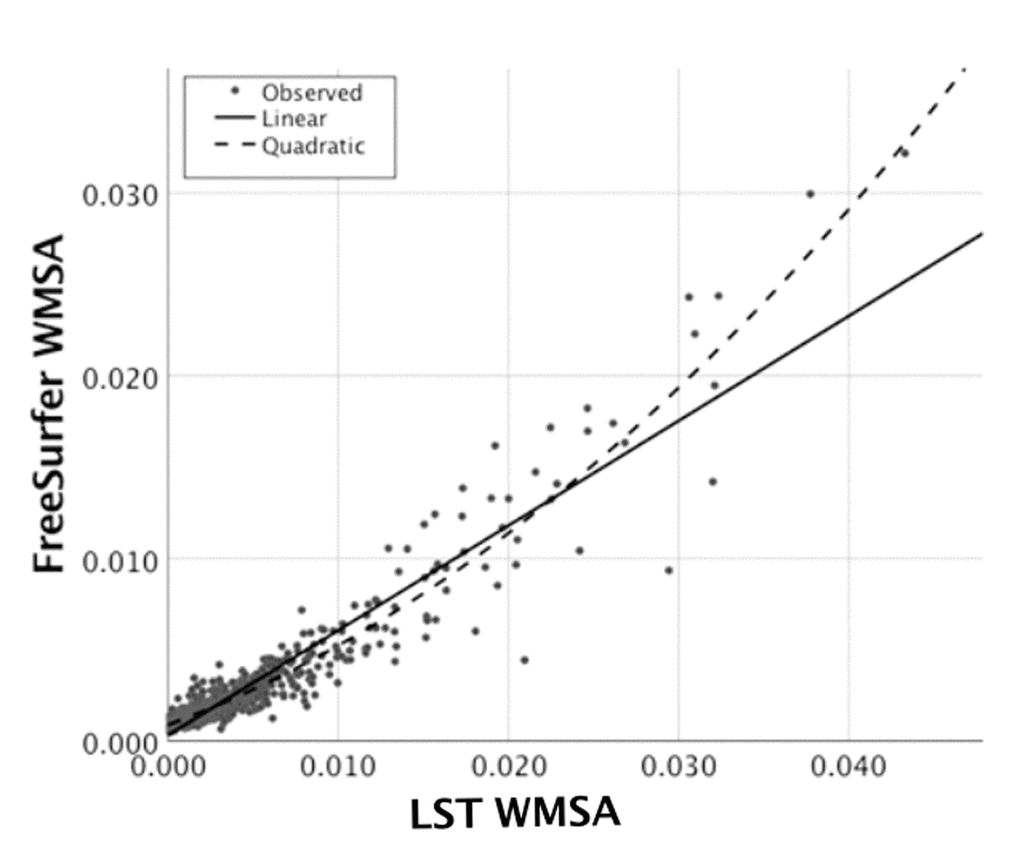
Figure 2.Association between hyperintense WMSA based on the LST software and hypointense WMSA based on the FreeSurfer software. The Figure shows the linear and quadratic association between LST WMSA (x axis) and FreeSurfer WMSA (y axis) volume in milliliters after adjusting for each participant’s TIV. WMSA: White matter signal abnormalities; TIV: total intracranial volume; LST: Lesion segmentation tool.