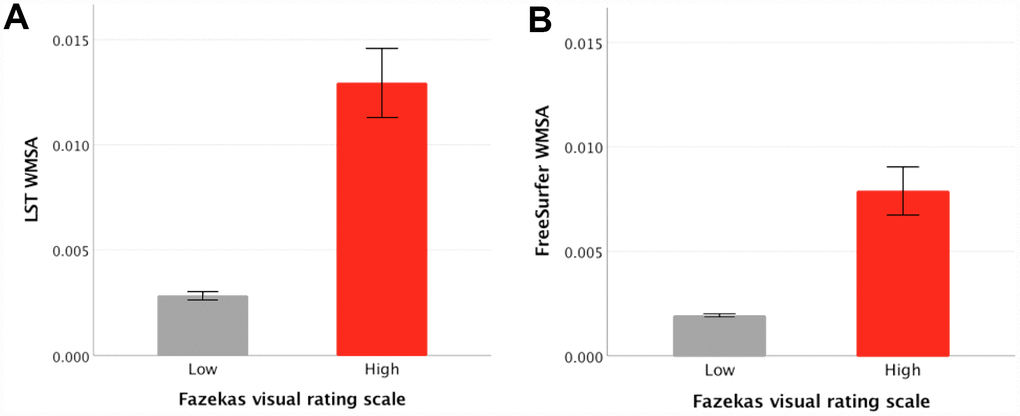
Figure 3.Mean differences between low and high Fazekas WMSA burden in hyperintense WMSA from LST and hypointense WMSA from FreeSurfer. (A) shows FreeSurfer WMSA levels for low and high Fazekas scores, error bars represent the standard error; (B) shows LST WMSA levels for low and high Fazekas scores, error bars represent the standard error; The y axis represents WMSA volumes in milliliters after adjusting for each participant’s TIV. WMSA: White matter signal abnormalities; LST: Lesion segmentation tool; TIV: total intracranial volume.