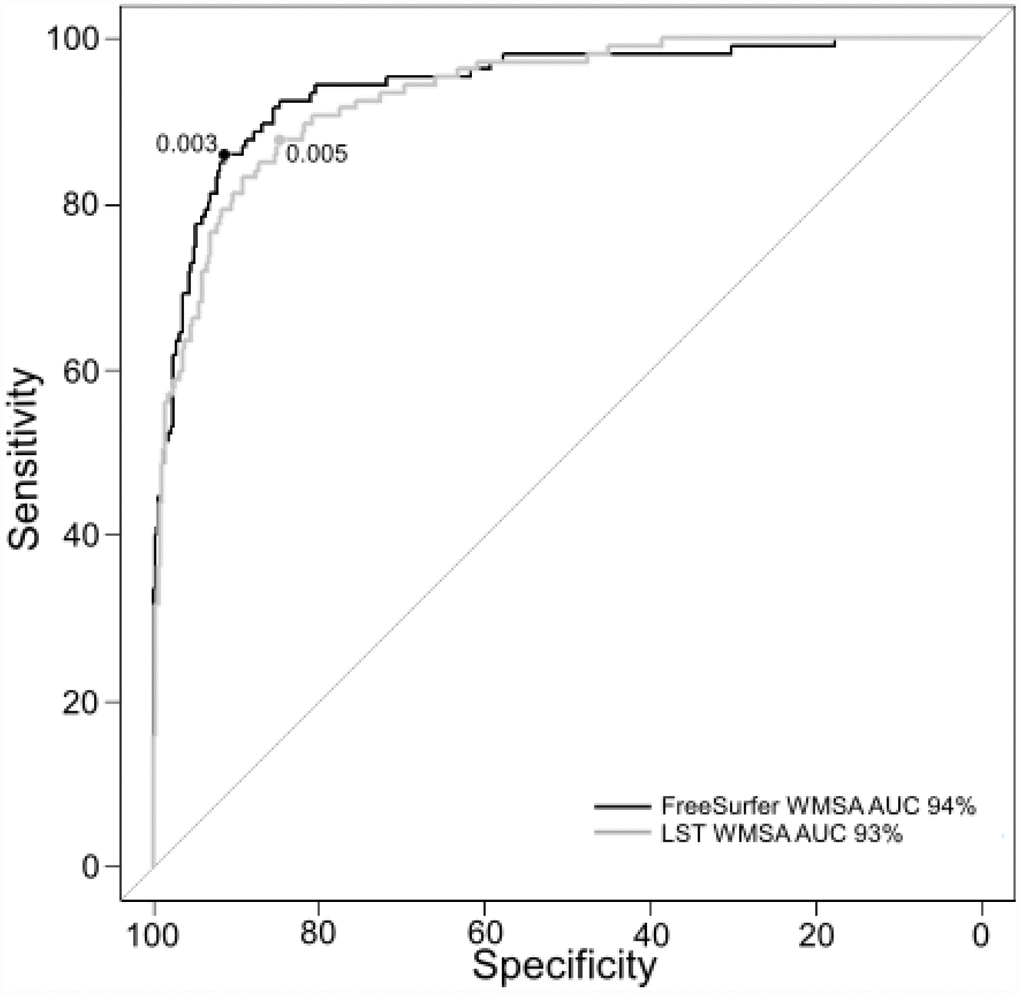
Figure 4.ROC curves for separating low and high Fazekas WMSA burden. The figure shows the ROC curves for separating low and high Fazekas WMSA burden for LST and FreeSurfer WMSA values (AUC and optimal cut-off values are shown for each software type). Fazekas scores were categorized as low WMSA burden (scores = 0 and 1) or high WMSA burden (scores = 2 and 3). WMSA: White matter signal abnormalities; AUC: Area under the curve; ROC: Receiver operating characteristic; LST: Lesion segmentation tool.