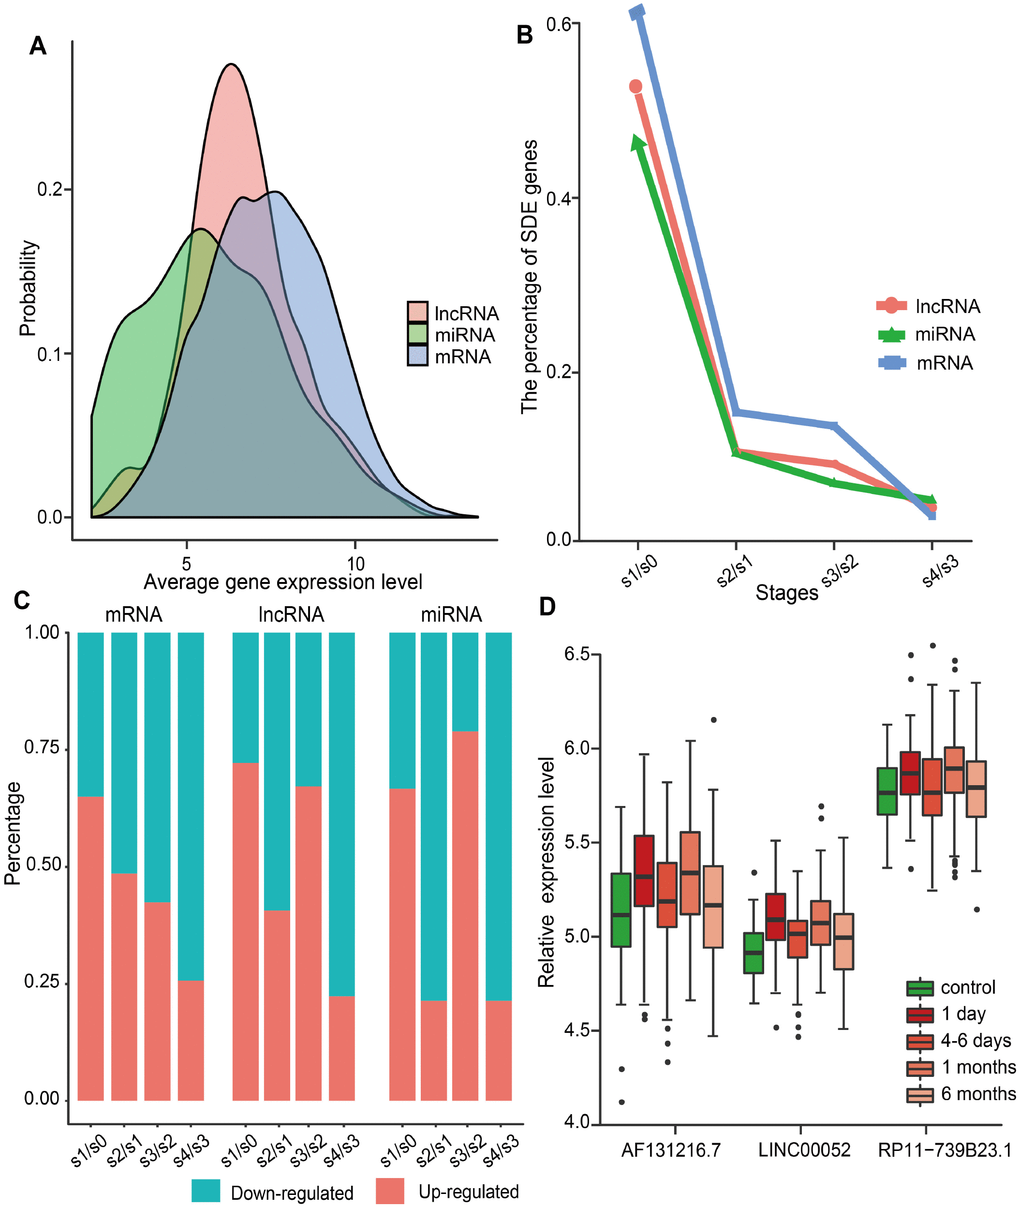
Figure 1.Global gene expression distribution in MI and analysis of SDE genes during MI progression. (A) Expression distribution of mRNAs, lncRNAs, and miRNAs in MI patients. (B) Percentage of SDE mRNAs, lncRNAs, and miRNAs estimated by comparing expression data between adjacent stages during MI progression. S0, control; S1, day 1 of MI; S2, 4-6 days after MI; S3, 1 month after MI; S4, 6 months after MI. (C) Percentage of upregulated and downregulated SDE genes during MI progression. (D) Relative expression levels of three lncRNAs that showed differential expression at each MI stage.