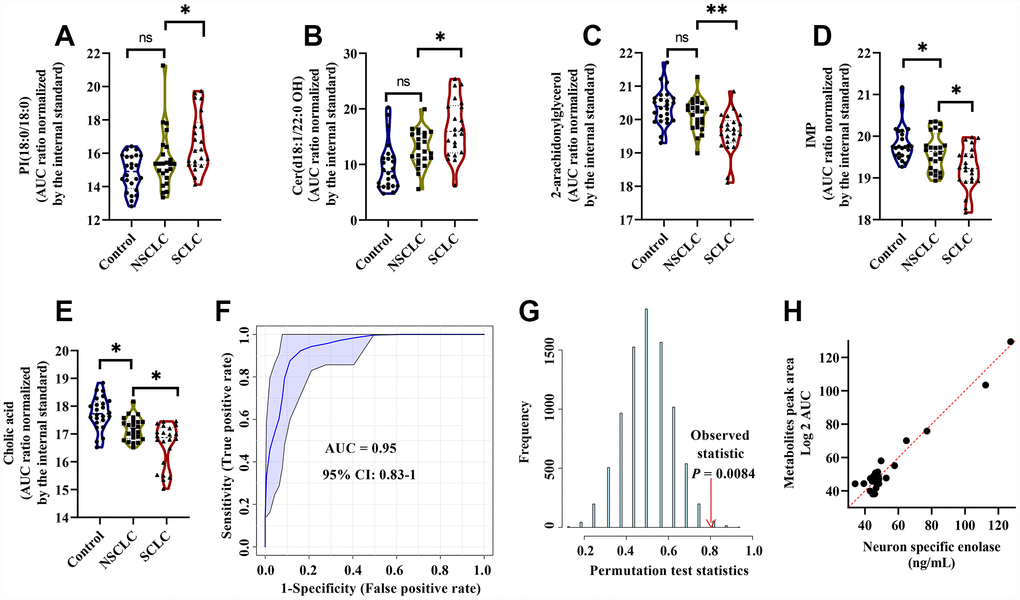
Figure 5.The diagnostic performance of the developed multianalyte discriminant model for male SCLC in the discovery set. (A–E) Violin plots showed the relative levels of five selected metabolites in the model. (A) PI(18:0/18:0); (B) Cer(d18:1/22:0 OH); (C) 2-Arachidonoylglycerol; (D) IMP; and (E) Cholic acid. The AUC ratio for each metabolite was calculated by the AUC of the corresponding internal standard. One-way ANOVA followed by Tukey’s test was used. *P < 0.05 and ns: nonsignificant. (F) ROC curve analysis for distinguishing male SCLC patients from NSCLC and controls. (G) The random permutation test to examine the robustness of the model. Permutation P-value represented the probability that the classification of SCLC and NSCLC and controls using the selected metabolites could be obtained by chance. (H) Multiple linear regression analysis showed a significant correlation between the five selected metabolites and serum neuron-specific enolase (NSE) in male SCLC patients. R2 = 0.63, P < 0.01. Abbreviations: IMP = inosine monophosphate; PI = Phosphatidylinositol; Cer = Ceramide; NSCLC = non-small cell lung cancer; NSE = neuron-specific enolase; ROC = receiver operator characteristic; SCLC = small cell lung cancer.