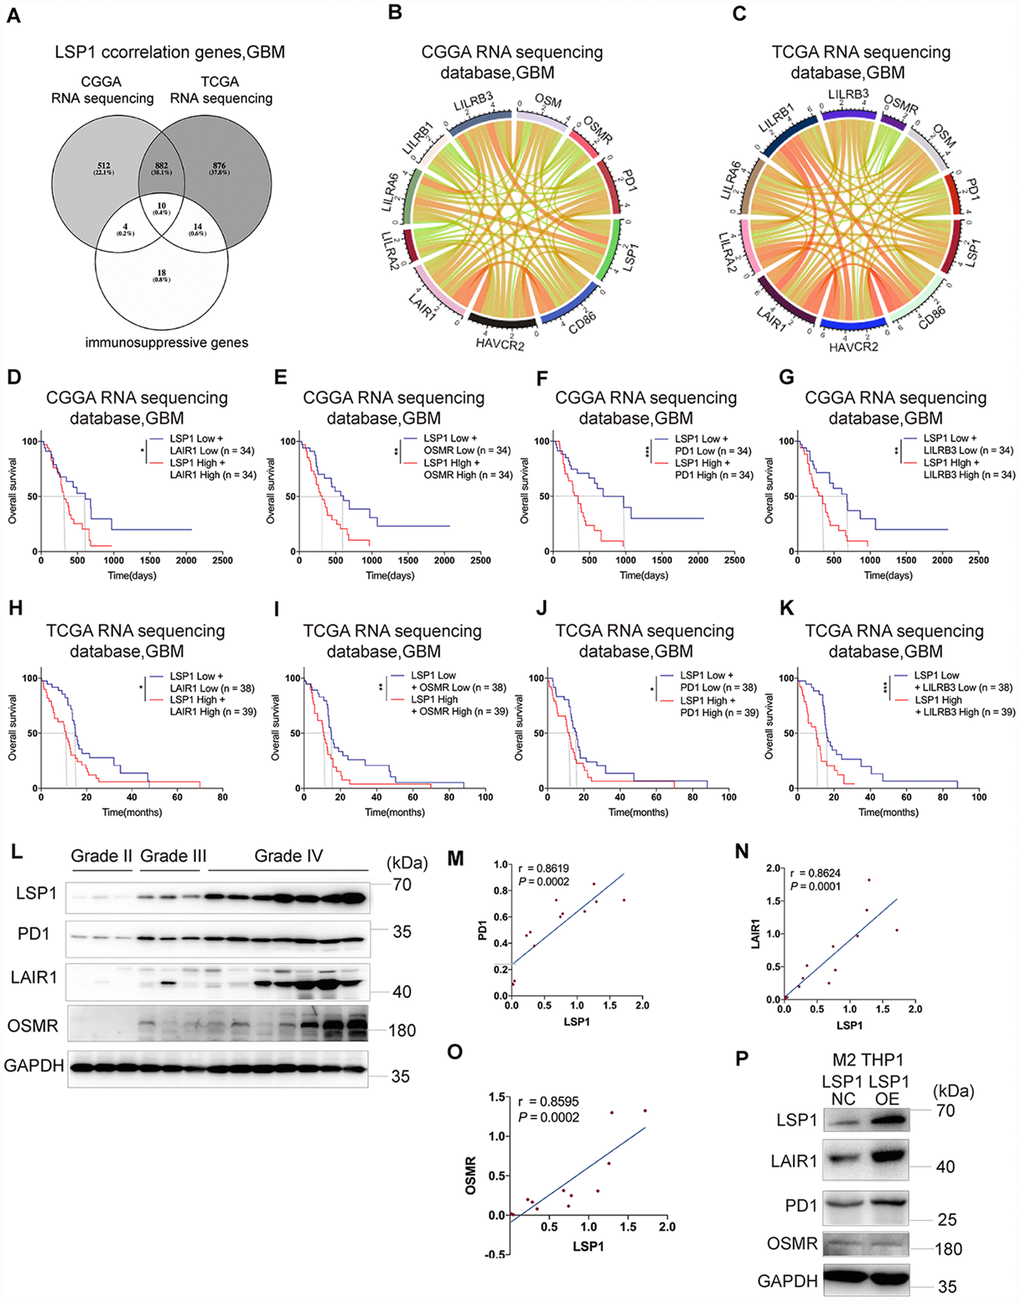
Figure 6.The expression of immunosuppressive genes is a major feature in GBM with high LSP1 expression. (A) A venn diagram showing the 10 overlapping immunosuppressive genes positively correlated with high LSP1 expression in CGGA and TCGA RNA sequencing datasets, and immunosuppressive gene sets. (P < 0.05; with t test). (B and C) Correlation analyses of LSP1 and the above 10 immunosuppressive genes in GBM (B, CGGA RNA sequencing dataset, n = 138; C, TCGA RNA sequencing dataset, n = 155; with Pearson correlation analysis). (D–K) Kaplan-Meier curves describing combined prognostic value of LSP1 and LAIR1, OSMR, PD1, LILRB3 expression in GBM (D–G, CGGA RNA sequencing dataset; H–K, TCGA RNA sequencing dataset; with log-rank test). (L) Representative western blot images of LSP1, PD1, LAIR1 and OSMR in clinical tissues (Grade II n = 3; Grade III n = 3; Grade IV n = 7). (M–O) The correlation analysis of LSP1 with PD1 (M), LAIR1 (N) or OSMR (O) in clinical tissues with western blot (PD1: r = 0.8619, P = 0.0002; LAIR1: r = 0.8624, P = 0.0001; OSMR: r = 0.8595, P = 0.0002; with Pearson correlation analysis). (P) Representative western blot images showing LSP1 overexpression significantly increased PD1 and LAIR1 expression in M2 macrophages induced from THP-1 cells. *, ***, and **** indicate P < 0.05, P < 0.001, and P < 0.0001, respectively. *, **, and *** indicate P < 0.05, P < 0.01, and P < 0.001, respectively. CGGA, Chinese Glioma Genome Atlas; TCGA, The Cancer Genome Atlas; GBM, glioblastoma multiforme.