


Introduction
In recent years, researchers have obtained remarkable progress in the field of cancer immunotherapy, which provides new options for the treatment of cancers [1–3]. Dramatic responses have been observed across various tumor types with immunotherapy, particularly immune checkpoint inhibitors and chimeric antigen receptor (CAR) T cells [4, 5]. However, not all tumors are susceptible to current immunotherapy strategies, and even among those patients who do have a response, the effects are not durable [6, 7]. Thus, there is a critical unmet need to identify the mechanisms of response and resistance to immunotherapy, and design rational combination strategies [8, 9]. The understanding of immune response in tumor microenvironment need to be further improved, because of its complex and dynamic nature [10, 11].
Glioblastomas (GBM) is the most common primary malignant tumor in adult central nervous system and carries an abysmal 10.1% 3-year survival rate with standard care of surgery, radiation therapy and temozolomide chemotherapy [12]. New therapies are desperately needed for these patients. The immunosuppressive and cold phenotype of tumor microenvironment (TME) has been identified as a key regulator in GBM progression and recurrence [13]. TME in GBM is a unique challenge to treat, because tumor cell extrinsic components are native to the brain, as well as tumor intrinsic mechanisms which aid in immune evasion [14]. Targeting the genetically stromal components and reducing the immunosuppression caused by these cells is expected to convert the “cold” TME to a more “hot” TME phenotype, and may create new opportunities for GBM patients and circumvents the complications of tumor antigen directed therapies [14]. Recently, a clinical trial found that neoadjuvant anti-PD-1 immunotherapy promotes a survival benefit in recurrent glioblastoma [15]. The recruitment and function of different types of immune cells in the TME markedly change during tumor evolution in a manner that appears to be strongly context dependent [16, 17]. For example, tumor associated macrophages (TAMs) and neutrophils have been shown to produce pro-inflamatory cytokines, regulate glioma stem cell pools, and induce resistance to anti-angiogenic therapies [18, 19]. Understanding the mechanism of this process will help us find new TME-target strategies against GBM.
As a component of the podosome cap, Leukocyte-specific protein 1 (LSP1) is a myosin-associated regulator of macrophage phagocytosis and immune cell migration in inflammation [20, 21]. Aberrant LSP1 overexpression leads to reduced motility of neutrophils in the patients with neutrophil actin dysfunction [22]. LSP1 deficiency leads to enhanced T cell migration, and contributes to the development of rheumatoid arthritis [21]. In hematopoietic cells, LSP1 is an F-actin-binding protein that has a scaffold for the Ras-mitogen-activated protein kinase pathway and promotes leukocyte migration [23]. Loss of LSP1 expression leads to enhanced skin wound healing, suggesting a role for LSP1 in cell proliferation [24, 25]. However, the expression pattern of LSP1 and its role in cancer biology and the regulation of the TME remain to be further explained.
Therefore, in present study, we first summarized a list of leukocyte migration related genes. Then we investigated the expression pattern of these genes in GBM and identified LSP1 as the leukocyte migration related gene with the most correlated with GBM patient. Second, we explored the value of LSP1 as a prognostic molecule in glioma with data from Chinese Glioma Genome Atlas (CGGA) and The Cancer Genome Atlas (TCGA). The expression of LSP1 was further verified with quantitative PCR (qPCR), immunohistochemistry and western blot in clinical tissue samples. In addition, we verified the potential of LSP1 as an independent risk factor for glioma malignancy and a therapeutic molecule for targeted strategies of glioma. Moreover, function annotation of LSP1 in GBM showed its function in strengthening the local immune response and mediating immune suppression in GBM. The analyses on the correlation between LSP1 and immune cell populations in GBM’s TME revealed that LSP1 was significantly positive correlation with M2 macrophages, T regulatory (Treg) and neutrophils, and negatively correlated with cytotoxic lymphocytes. LSP1 also showed a close expressive relevance with immune checkpoint genes like PD-1 and promoted the migration of macrophages. Taken together, this study suggests LSP1 as a contributor of immunosuppressive TME in GBM and a possible therapeutic target in developing new therapeutic immune strategies in GBM.
Results
The analysis of leukocyte migration related genes in glioma identifies LSP1 as an independent risk factor for progressive malignancy in glioma
GBM’s microenvironment has been suggested to be a major determinant responsible for tumor recurrence and high lethality of GBM patients. The “cold” TME of GBM is characterized with relatively few tumor infiltrating lymphocytes (TILs) [26]. As leukocyte migration plays a key role in the distribution of immune cells throughout the body [27], the investigation on the expression of leukocyte migration related genes in GBM may help us identify the gene responsible for the regulation of immune cell infiltration in GBM. Based on these observations, we first summarized a list of leukocyte migration related genes (Supplementary Table 1) [23, 28] and analyzed the correlation between these genes and clinical pathological features, including tumor purity, immune score, stromal score, isocitrate dehydrogenase 1(IDH1) status, and subtypes, with CGGA and TCGA GBM RNA sequencing datasets. We found that most of genes related to leukocyte migration were significantly associated with glioma purity, including 1 overlapping positively purity-related gene and 21 overlapping negatively purity-related genes (Figure 1A, 1B; P < 0.05, r > 0.4 or r < -0.6) (Supplementary Table 2). Furthermore, we compared the expression pattern of these genes in low grade glioma (LGG) and GBM (P < 0.05, log2FC > 0.37) with CGGA and TCGA RNA sequencing data. The result showed that there were 61 overlapping differentially expressed genes in both datasets (Figure 1C, 1D and Supplementary Table 3). Combined these data, there were 8 leukocyte migration related genes (Supplementary Table 4), which were not only highly associated with glioma purity, but also differentially expressed between LGG and GBM. To compare the prognostic relevance of these 8 genes, we further performed a univariate Cox regression analysis with the survival data from CGGA and TCGA. The result demonstrated that LSP1 was the only gene significantly correlated with a poor prognosis in GBM (P < 0.01, Supplementary Table 4). We further examined the prognostic value of LSP1 expression in LGG and GBM with log-rank test. The data also demonstrated that patients with higher LSP1 expression had a significantly shorter survival times than their counterparts in both of LGG and GBM (Figure 1E–1H and Supplementary Figure 1A–1D). Therefore, we chose LSP1 as a further research target. Due to prominent heterogeneity of molecular nature across different grades of glioma, LSP1 expression was analyzed according to the 2016 WHO grade system. According to CGGA and TCGA, GBM showed the highest LSP1 expression in comparison to grade II and grade III glioma (Figure 2A, 2B, and Supplementary Figure 2A). Furthermore, we verified this result in clinical glioma samples with qPCR, western blot and IHC, and similar result was obtained (Figure 2C–2E). Additionally, we investigated the LSP1 expression level in benign tissue around LSP1 high tumor by IHC. The result showed that benign tissue around LSP1 high tumor had a significant lower LSP1 expression level than tumor tissue (Supplementary Figure 2B). The data of immunofluorescence colocalization showed that there were a few cells in GBM samples with co-staining of LSP1 and glial fibrillary acidic protein (GFAP), which may imply a tumor cell-related LSP1 expression in GBM (Figure 2G). Finally, we confirmed that higher LSP1 expression related to a shorter survival in GBM with clinical samples from our hospital with IHC (Figure 2F and Supplementary Table 5). Taken together, these data indicate the potential of LSP1 as an independent predicative factor for progressive malignancy in glioma and high LSP1 expression predicts unfavorable survival in glioma.
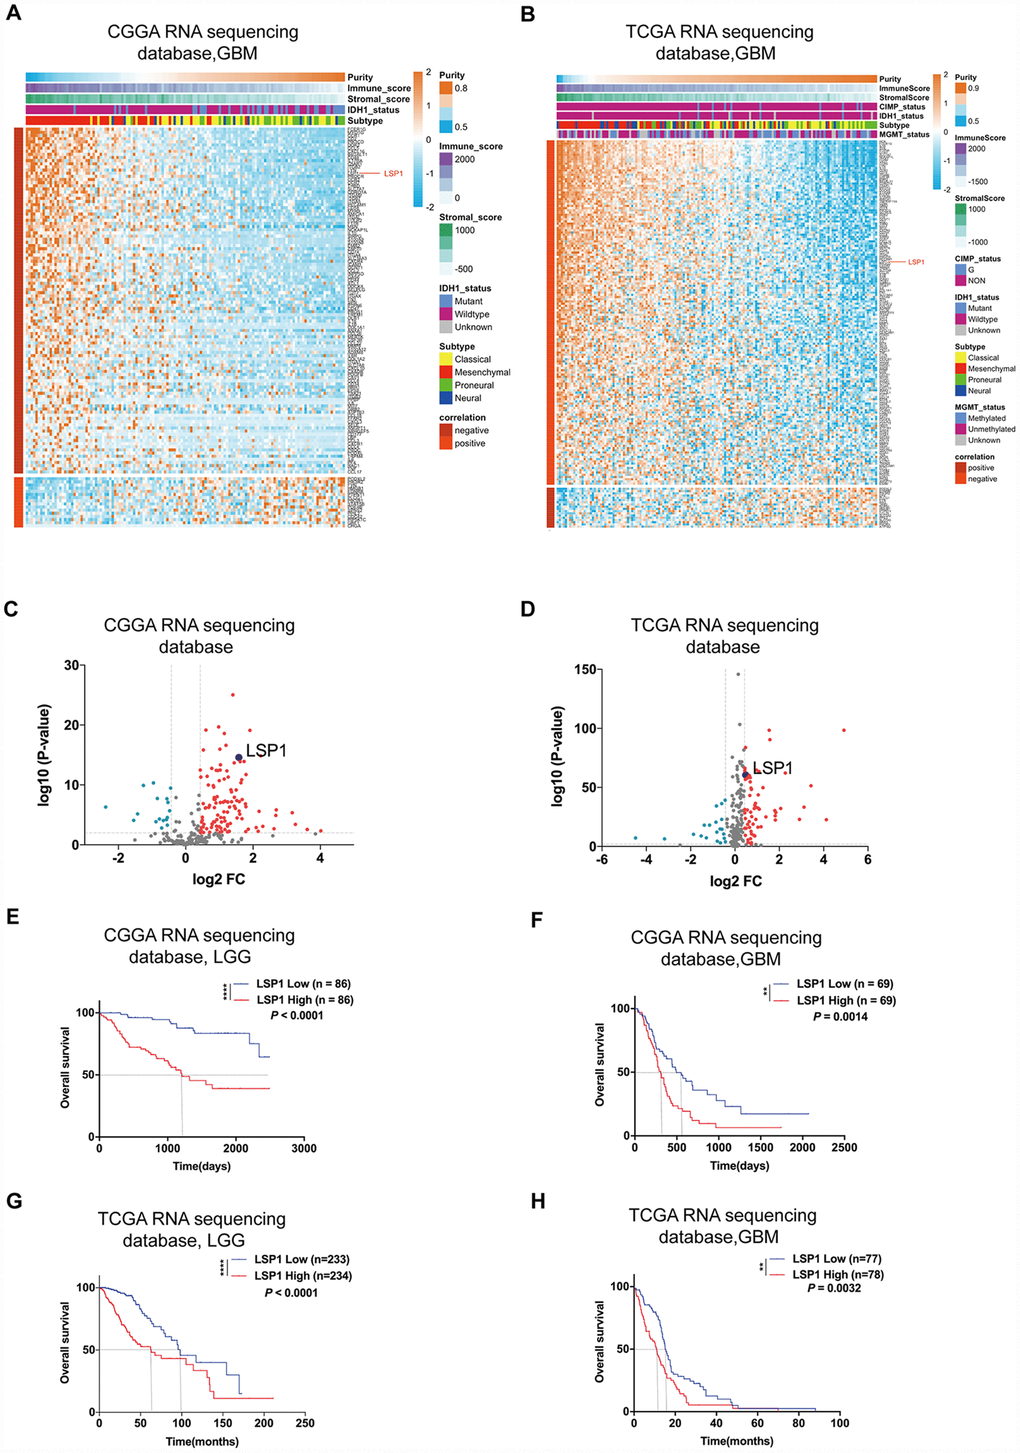
Figure 1. LSP1 was the only gene in leukocyte migration related genes, which not only had an elevated expression, but also was correlated with unfavorable prognosis in glioma. (A and B) Heatmaps describing the correlation between the expression of leukocyte migration related genes and tumor purity, immune and stroma scores, and IDH1 status in GBM (A, CGGA RNA sequencing dataset, n = 138; B, TCGA RNA sequencing dataset, n = 155). (C and D) Volcano plots showing differentially expressed leukocyte migration related genes between GBM and LGG (C, CGGA RNAseq, n = 310; D, TCGA RNAseq, n = 622; with t test). (E–H) Kaplan-Meier survival analyses revealed an association between high LSP1 expression and unfavorable outcomes in both of LGG and GBM (E, F: CGGA RNA sequencing dataset; G, H: TCGA RNA sequencing dataset; with log-rank test). **, and **** indicate no significance P < 0.01, and P < 0.0001, respectively. CGGA, Chinese Glioma Genome Atlas; TCGA, The Cancer Genome Atlas; GBM, glioblastoma multiforme; LSP1, lymphocyte specific protein 1; LGG, lower-grade glioma.
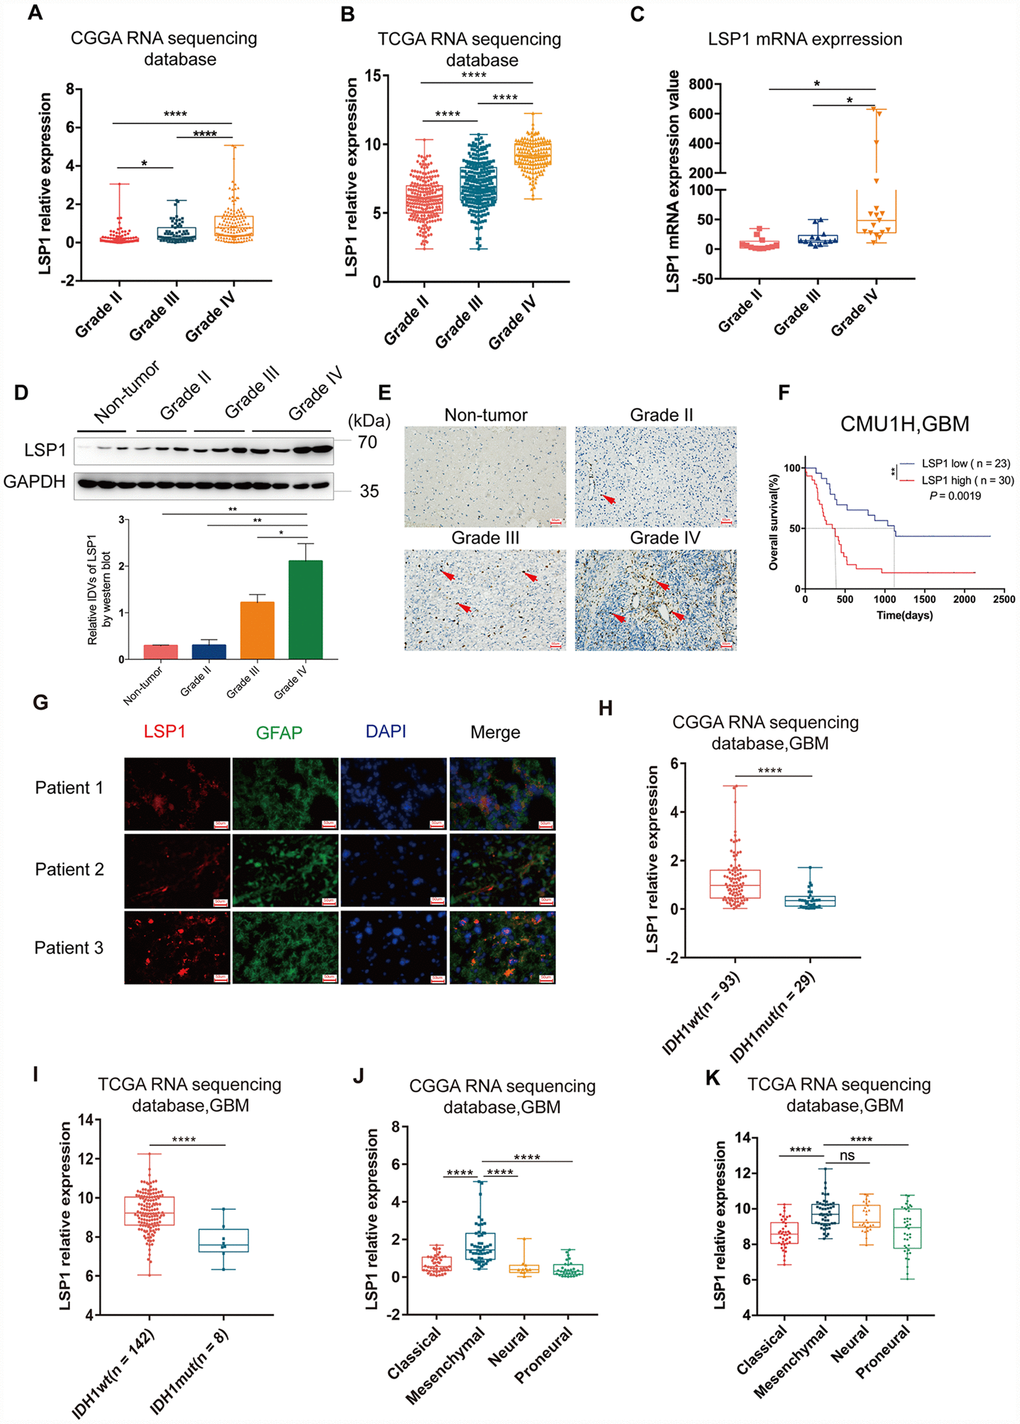
Figure 2. The analyses of LSP1 expression according to WHO grades, GBM subtypes and IDH1 mutant status. (A and B) LSP1 expression was significantly increased in GBM in comparison with WHO grade II and WHO grade III glioma (A, CGGA RNA sequencing dataset, Grade II n = 105; Grade III n = 67; Grade IV n = 138; B, TCGA RNA sequencing dataset, Grade II n = 224; Grade III n = 243; Grade IV n = 155; with one-way ANOVA). (C) qPCR analysis of LSP1 expression in clinical glioma samples (Grade II n = 11; Grade III n = 10; Grade IV n = 21; with one-way ANOVA). (D) Representative western blot images (upper panel) and analyses of LSP1 (lower panel) expressed in clinical tissues (Non-tumor n = 3; Grade II n = 3; Grade III n = 3; Grade IV n = 3; with one-way ANOVA). (E) Representative IHC images of LSP1 staining in clinical non-tumor and glioma samples (200X, scale bar = 50μm). (F) Kaplan-Meier curve evaluating the association of LSP1 expression with the prognosis of GBM patients (LSP1 high vs. low, P = 0.0019; with log-rank test). (G) Representative IF co-staining images of LSP1 and GFAP in clinical GBM samples (200X, scale bar = 50μm). (H and I) LSP1 expression was significantly upregulated in IDH1 wild type GBM (H, CGGA RNA sequencing dataset; I TCGA RNA sequencing dataset; with t test). (J and K) The expression analysis of LSP1 in four subtypes of GBM (J, CGGA RNAseq, Classical n = 47, Mesenchymal n = 50, Neural n = 11, Proneural n = 30; K, TCGA RNAseq, Classical n = 40, Mesenchymal n = 50, Neural n = 27, Proneural n = 38; with one-way ANOVA). ns, *, ** and **** indicate no significance, P < 0.05, P < 0.01, and P < 0.0001, respectively. CGGA, Chinese Glioma Genome Atlas; TCGA, The Cancer Genome Atlas; GBM, glioblastoma multiforme; LSP1, lymphocyte specific protein 1; GFAP, glial fibrillary acidic protein; DAPI, 4’,6-diamidino-2-phenylindole; IDH1, isocitrate dehydrogenase 1.
High LSP1 expression was enriched in IDH1 wild type and mesenchymal subtype of GBM
Next, investigation was performed with IDH mutation status as a sub-classifier. Mutation in IDH1 is a stable marker for better prognosis in both lower-grade glioma (LGG) and glioblastoma multiforme (GBM) [29]. As the earliest detectable genetic alteration in gliomagenesis, IDH1 heterozygous missense mutations in codon 132 cause an arginine-to-histidine substitution in 80–90 % of cases (R132H) [30] that leads to a distinct metabolism and hypermethylation phenotype in gliomas [31]. IDH1 mutations caused down-regulation of leukocyte chemotaxis, resulting in repression of the tumor-associated immune system [32]. Given that significant infiltration of immune cells such as macrophages, microglia, monocytes, lymphocyte, and neutrophils is linked to poor prognosis in many cancer types, these disrupted immune infiltrates in IDH1 mutation glioma tumors may contribute to the different aggressiveness of these two glioma types. Therefore, we compared LSP1 expression between IDH1 mutation and wild type. The result indicated that GBM with wild type IDH1 presented a higher level of LSP1 expression (Figure 2H, 2I and Supplementary Figure 2C–2E). This suggested that elevated LSP1 expression was more common in IDH1 wild-type glioma and further reflected different biological genetic background between these two kinds of tumors. Moreover, we found that mesenchymal GBM exhibited a higher expression level of LSP1 than another three subtypes (proneural, classical, and neural) (Figure 2J, 2K and Supplementary Figure 2F–2H). We further employed ROC curve and AUC measurement to examine the sensitivity and specificity of LSP1 as a marker for mesenchymal GBM. The result confirmed the potential of LSP1 to distinguish mesenchymal subtype in GBM (Supplementary Figure 2I, 2J). Altogether, these findings indicated that LSP1 expression was elevated in GBM, especially in IDH1 wild type and mesenchymal subtype tumors.
LSP1 predicts radiotherapeutic and chemotherapeutic response in GBM patients
Previous studies indicated that LSP1 expression was associated with malignant biologic process in malignancies like breast cancer and Hodgkin’s disease [33, 34]. Since these malignant biological behaviors have been reported to contribute to radiotherapy and chemotherapy resistance [35], we employed multivariate Cox regression and survival analyses to examine whether LSP1 could serve as a marker for the prediction of the response to radiotherapy and chemotherapy in GBM patients. The result of multivariate Cox regression analysis revealed that LSP1 expression was significantly associated with the survival of GBM patients with radio- and chemo-therapy (Supplementary Table 6). Moreover, according to treatment strategies (whether to receive radiation therapy) and LSP1 expression, we divided the samples in CGGA and TCGA into four groups, including high LSP1 expression with or without radiotherapy and low LSP1 expression with or without radiotherapy. We found that no matter whether LSP1 expression in GBM patients was high or low, patients receiving radiotherapy had a longer survival times compared to those without radiotherapy (Figure 3A, 3B and Supplementary Figure 3A, 3B). But the low LSP1 group had a survival advantage compared to high group in GBM patients receiving radiotherapy, but not those without radiotherapy (Figure 3A, 3B and Supplementary Figure 3A, 3B). This suggested that LSP1 might participant in mediating radiotherapy resistance in GBM patients. O6-methylguanine-DNA methyltransferase (MGMT) promoter methylation has been identified as a predictive marker for GBM patients treated with temozolomide (TMZ) chemotherapy, and Higher level of MGMT promoter unmethylation lead to TMZ resistance [36]. The analyses of LSP1 expression in three TCGA GBM datasets did not show consistent results between MGMT promoter methylated and unmethylated group. LSP1 had a higher expression in MGMT promoter unmethylated group in two microarray datasets, but not in RNA sequencing dataset (Supplementary Figure 3C–3E). We further analyzed the association between LSP1 expression and the survival of GBM patients with different MGMT promoter status. Based on MGMT promoter status and LSP1 expression, the samples in TCGA were divided into three groups, including MGMT promoter methylated with high or low LSP1 expression and MGMT promoter unmethylated. The result showed that the low LSP1 group had a survival advantage compared to high group with methylated MGMT promoter (Figure 3C and Supplementary Figure 3F, 3G). In contrary, there was no survival difference between MGMT promoter unmethylated and methylated group with higher expression of LSP1, which suggested higher expression of LSP1 could eliminate the prognosis advantage of MGMT promoter methylation (Figure 3C and Supplementary Figure 3F, 3G). Lastly, the analyses with the data from three TCGA datasets showed that high LSP1 expression with methylated MGMT promoter had no significant survival advantage over unmethylated group in chemotherapy patients (Figure 3D and Supplementary Figure 3H, 3I). This suggested that LSP1 mediating chemotherapy resistance in GBM may be closely related to MGMT promoter methylation. Collectively, these data indicate that LSP1 could serve as a molecule for the response prediction to radiotherapy and chemotherapy in GBM.
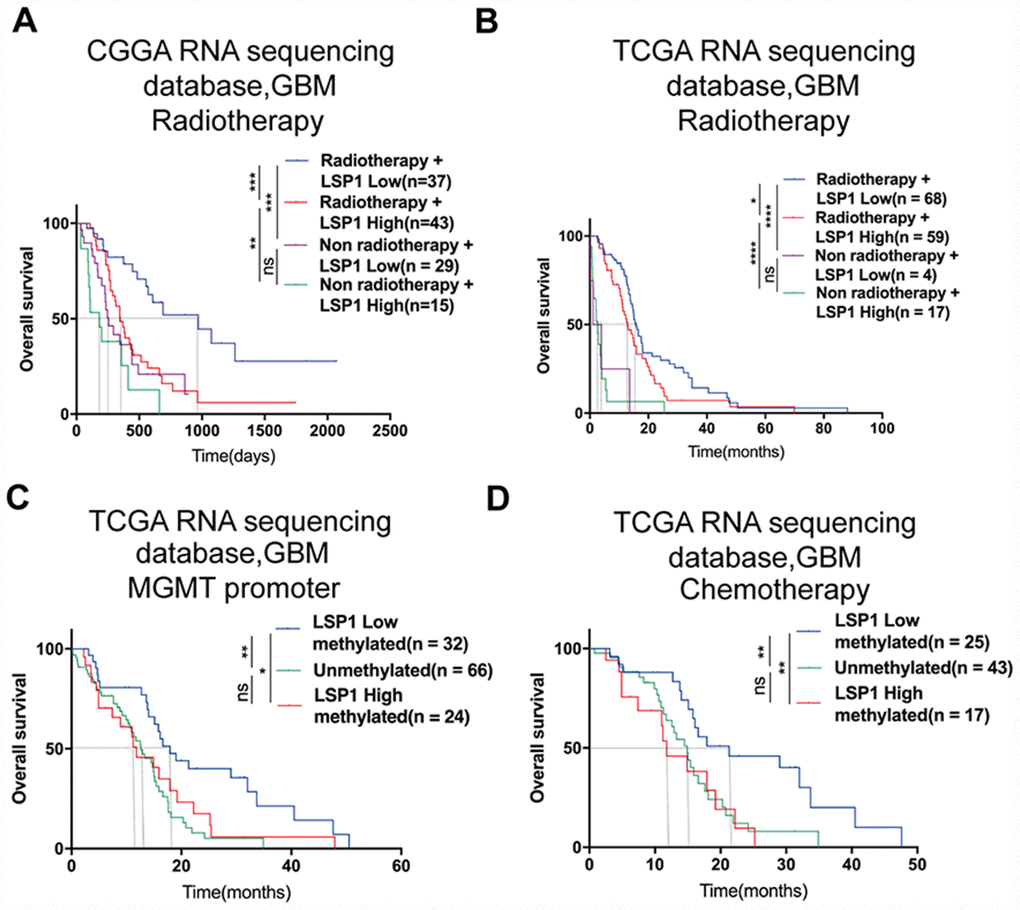
Figure 3. LSP1 exhibited the potential as a molecule for predicting radiotherapeutic and chemotherapeutic response in GBM. (A and B) Kaplan-Meier curves describing the association between LSP1 expression and the survival of GBM patients treated with or without radiotherapy (A, CGGA RNA sequencing dataset; B, TCGA RNA sequencing dataset; with log-rank test). (C) Kaplan-Meier curve describing the correlation between LSP1 expression and the survival of GBM patients with different MGMT promoter status in TCGA RNA sequencing dataset (with log-rank test). (D) Kaplan-Meier curve describing the correlation between LSP1 expression and the survival of GBM patients receiving chemotherapy in TCGA RNA sequencing dataset (with log-rank test). ns, *, **, *** and **** indicate no significance, P < 0.05, P < 0.01, P < 0.001, and P < 0.0001, respectively. CGGA, Chinese Glioma Genome Atlas; TCGA, The Cancer Genome Atlas; GBM, glioblastoma multiforme; LSP1, lymphocyte specific protein 1; MGMT, O6-methylguanine-DNA methyltransferase.
Functional enrichment analyses reveal that LSP1 is associated with immunologic events
Next, we focus on exploring the functional role of LSP1 in GBM. A list of genes positively correlated with LSP1 expression (Pearson r > 0.5, and P < 0.05) was obtained from CGGA and TCGA GBM RNA sequencing datasets, respectively (Supplementary Table 7). GO analysis was performed based on this gene list. And the result showed that genes most relevant to LSP1 were mostly involved in the regulation of leukocyte migration, immune response, and inflammatory response (Figure 4A, 4B). While genes that negatively correlated with LSP1 expression (r < -0.4, and P < 0.05) contributed to the regulation of normal biological process, such as brain and spinal cord development (Supplementary Figure 4A, 4B). Additionally, in consistent with the above data, the results of GSVA showed the enrichment of leukocyte migration, inflammatory response, and the regulation of immune response phenotypes in samples with high LSP1 expression (Figure 4C, 4D). GSEA also demonstrated a close association between LSP1 expression and the regulation of leukocyte migration, inflammatory response, and immune response in GBM (Figure 4E and Supplementary Figure 4C, 4D). Moreover, we summarized the overlapping up-regulated genes correlated with high LSP1 expression in CGGA and TCGA RNA sequencing datasets (Pearson r > 0.3, and P < 0.05). There were 892 overlapping up-regulated genes (Supplementary Table 8). As shown in Figure 4F, the result of KEGG pathway analysis showed that LSP1 was significantly correlated to immune related pathways, such as leukocyte trans-endothelial migration, NF-kappa B signaling pathway, cytokine-cytokine receptor interaction, and primary immunodeficiency. These findings imply that LSP1 may play an important role in regulating immunologic biological processes of GBM.
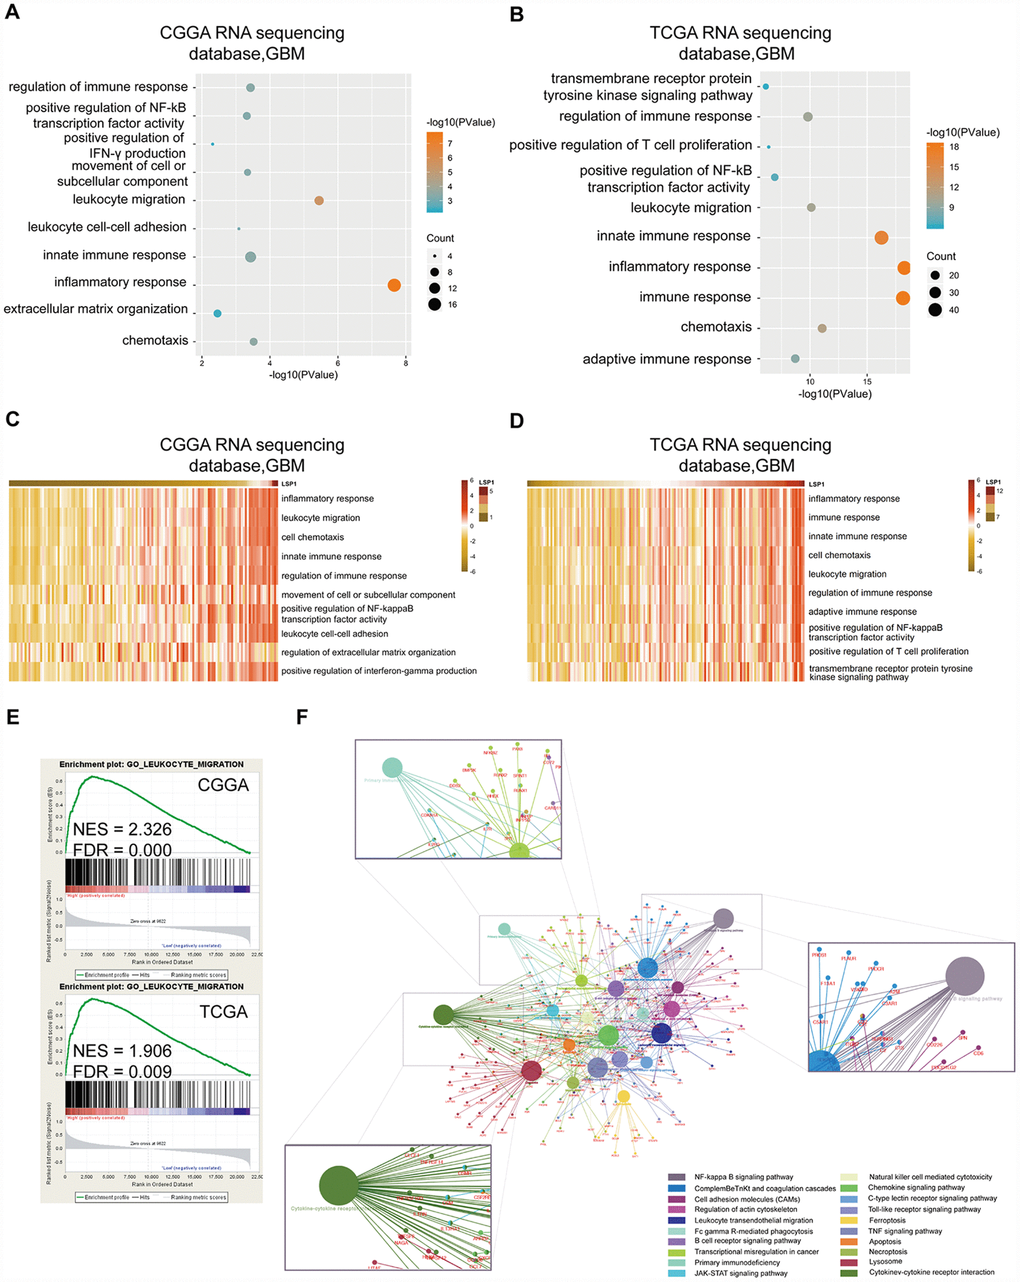
Figure 4. Functional enrichment analysis revealed that LSP1 was associated with immunologic events. (A and B) The results of GO analysis describing biological processes associated with LSP1 positive-correlated genes in GBM (A, CGGA RNA sequencing dataset; B, TCGA RNA sequencing dataset). Bubble diameter: enrichment gene counts; abscissa: -log 10 P-value (P < 0.05). (C and D) The GO terms correlated with high LSP1 expression in GBM by GSVA (C, CGGA RNA sequencing dataset; D, TCGA RNA sequencing dataset). (E) The results of GSEA indicating a significantly enhanced leukocyte migration in GBM with high LSP1 expression (upper panel, CGGA RNA sequencing dataset; lower panel, TCGA RNA sequencing dataset; P < 0.05 and FDR < 0.01). (F) The LSP1 related pathways revealed by 892 overlapping LSP1 positively related genes in CGGA and TCGA RNA sequencing datasets with ClueGO. CGGA, Chinese Glioma Genome Atlas; TCGA, The Cancer Genome Atlas; GBM, glioblastoma multiforme; LSP1, lymphocyte specific protein 1.
High LSP1 expression is accompanied by increasing macrophage, neutrophil and Treg cell infiltrating GBM
The TME of glioma contains noncancerous cell types including immune and stroma cells, which may promote tumor progression and mediate therapeutic resistance via extensive crosstalk with glioma cells in the TME [13]. Through mutual relationship analysis of LSP1 expression and noncancerous cells with MCP-counter method, we found that LSP1 expression was strongly negatively associated with cytotoxic lymphocytes, and positively correlated with B lineage, monocytic lineage neutrophils, and fibroblasts in GBM TME (Figure 5A, 5B). To further explore the relation between LSP1 and different nontumor cell populations in the TME, we analyzed the enrichment scores of 24 noncancerous cell types by GSVA (Figure 5C, 5D) [37]. The result demonstrated that LSP1 was negatively related with cytotoxic lymphocytes and positively related with Tregs, neutrophils and macrophage, especially M2 macrophage. Tregs are generated from the bone marrow and the thymus. In glioma patients, there is an increased proportion of immunosuppressive Tregs within the remaining CD4 + cell pool in blood, and a prominent infiltrating Treg population within GBM tumor tissue [13]. Neutrophils come from the bone marrow and are mobilized into the blood during inflammation. Neutrophils in glioma tissue are infiltrated from blood.
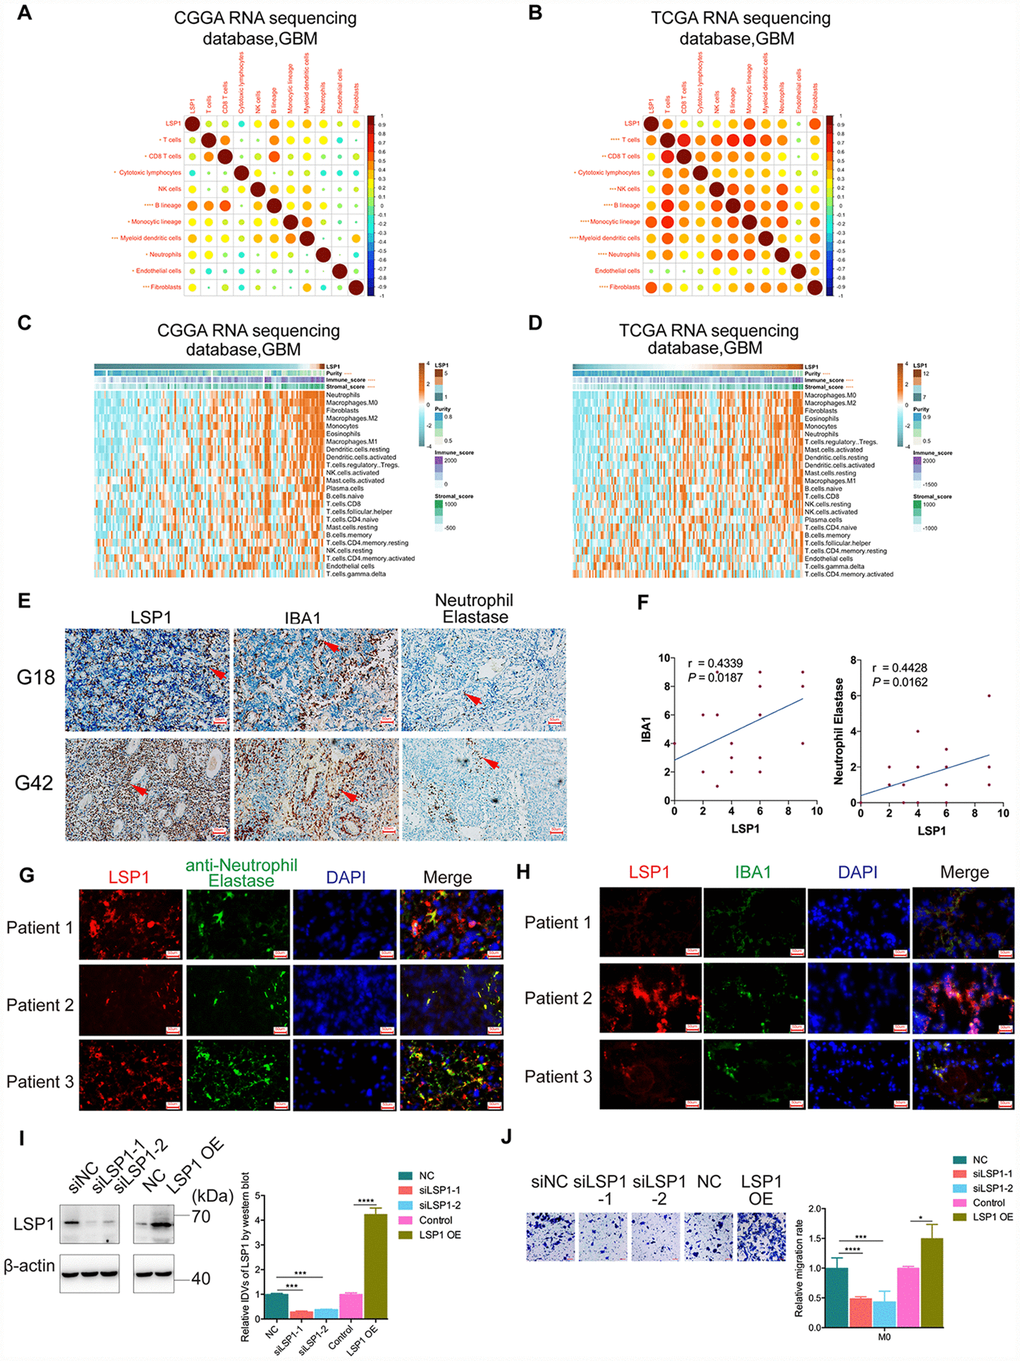
Figure 5. High LSP1 expression contributed to the immunosuppressive microenvironment in GBM. (A and B) The correlation analysis of LSP1 expression and non-tumor immune and stromal cell populations in GBM by MCP-counter (A, CGGA RNA sequencing dataset, n = 138; B, TCGA RNA sequencing dataset, n = 155; with Pearson correlation analysis). (C and D) Association of LSP1 expression with tumor purity, immune and stromal score, and twenty-four immune cell populations in GBM microenvironment by GSVA. (C, CGGA RNA sequencing dataset, n = 138; D, TCGA RNA sequencing dataset, n = 155; with Pearson correlation analysis). (E and F) Representative IHC images (E, 200X, scale bar = 50μm) and analysis (F) verifying LSP1 expression correlated with macrophages and neutrophil in 29 cases of GBM samples (macrophage: r = 0.4339, P = 0.0187; neutrophil: r = 0.4428, P = 0.0162; n = 15; with Pearson correlation analysis). (G) Representative IF images of LSP1 (red), Neutrophil Elastase (green), and DAPI (blue) staining in clinical GBM samples (n = 3) (200X, scale bar = 50μm). (H) Representative IF images of LSP1 (red), IBA1 (green), and DAPI (blue) staining in clinical GBM samples (n = 3) (200X, scale bar = 50μm). (I) Representative western blot image (left panel) and analysis (right panel) of LSP1 expression in M0 macrophages induced from THP-1 cells. (J) Transwell assay showing LSP1 knockdown inhibit the migration of M0 macrophages, and LSP1 overexpression enhanced their migration. CGGA, Chinese Glioma Genome Atlas; TCGA, The Cancer Genome Atlas; GBM, glioblastoma multiforme; LSP1, lymphocyte specific protein 1; IBA1, ionized calcium binding adapter molecule 1; DAPI, 4’,6-diamidino-2-phenylindole; IDH1, isocitrate dehydrogenase 1.
Additionally, TAMs in GBM are monocyte-derived macrophages from peripheral blood. Macrophages can be categorized into M1 and M2 subtypes based on their polarization status. Glioma cell could recruit M2 tumor-associated macrophages and promote their growth [38]. Furthermore, our previous research revealed that macrophage and neutrophil indicated poor prognosis in glioma patient [39]. Thus, we further performed IHC staining of LSP1, IBA1 (macrophage marker) and Neutrophil Elastase (neutrophil marker) in 29 clinical GBM samples. There were73.33% (11/15) high macrophage and 66.67% (10/15) high neutrophil infiltrated in LSP1-high GBM tissue samples. Simultaneously, 71.43% (10/14) low macrophage infiltration and 64.29% (9/14) low neutrophil infiltration in LSP1-low GBM tissue (Figure 5E, 5F). Moreover, the result of immunofluorescence colocalization confirmed that LSP1 was expressed in neutrophils and macrophages in GBM tissue (Figure 5G, 5H). This matched the above results of GO analysis, GSVA and GSEA. We further investigated the level of LSP-1 expression in glioma cells (U87, LN229, T98, and PGC21) and non-tumor cells (NHA, THP1(M0), THP1 induced M1 and M2 cells, and PBMC). The results showed that the expression levels of LSP1 in THP1(M0), M1 and M2 macrophages induced from THP1 cells, and PBMC were significantly higher than that in tumor cells (Supplementary Figure 5A, 5B). Thus, we proposed that LSP1 mainly functioned with non-tumor cell population in GBM. Based on this observation, we investigated the effect of LSP1 in M0 macrophages induced from THP1 cells on GBM migration abilities. As shown in Figure 5I and 5J, LSP1overexpression in M0 macrophages induced from THP1 cells increased their migration abilities. But LSP1 overexpression in U87 and PGC21 (a primary adherent glioma cell line from a clinical GBM sample) glioma cells didn’t increased their migration abilities (Supplementary Figure 5C, 5D). Together, these results indicate that LSP1 might contribute to the immunosuppressive response in GBM, and regulate the behaviors of immune cells like macrophages (M2).
The up-regulated expression of immunosuppressive genes and LSP1 is a major feature in GBM
Last, on the basis of above results, we investigated the correlation between LSP1 expression and immunosuppressive genes in GBM (Supplementary Table 9). The result demonstrated strong correlations between LSP1 and the following molecules, including OSM, OSMR, PD1, CD86, HAVCR2, LAIR1, LILRA2, LILRA6, LILRB1 and LILRB3 (Figure 6A–6C). This matched with the analysis of LSP1-immune-related pathways (cytokine-cytokine receptor interaction) in the CCGA and TCGA RNA sequencing datasets (Figure 4F). Furthermore, we evaluated the prognosis value of the combination of LSP1 and OSM, OSMR, PD1, CD86, HAVCR2, LAIR1, LILRA2, LILRA6, LILRB1, and LILRB3 expression. We found that LAIR1, OSMR, PD1, and LILRB3 had the prognosis value of the combination with LSP1 in the CGGA and TCGA datasets in GBM, and the co-upregulation of LSP1 and these genes is a predictor of poor survival in GBM patients, respectively (Figure 6D–6K). Due to the important roles of PD1, LARI1, and OSMR contributing to immunosuppressive microenvironment, we further examined the co-expression of LSP-1 and PD1, LARI1, and OSMR in clinical different grades glioma samples by IHC (Figure 6L). We found a correlation between LSP-1 expression and these genes (Figure 6O). In addition, we performed LSP1 overexpression in M2 macrophages induced from THP-1 cells. We found that elevated LSP1 expression increased their LAIR1 and PD1 expression, but not OSMR (Figure 6P). Collectively, these data further support a crucial role of LSP1 in the regulation of immune response in GBM TME.
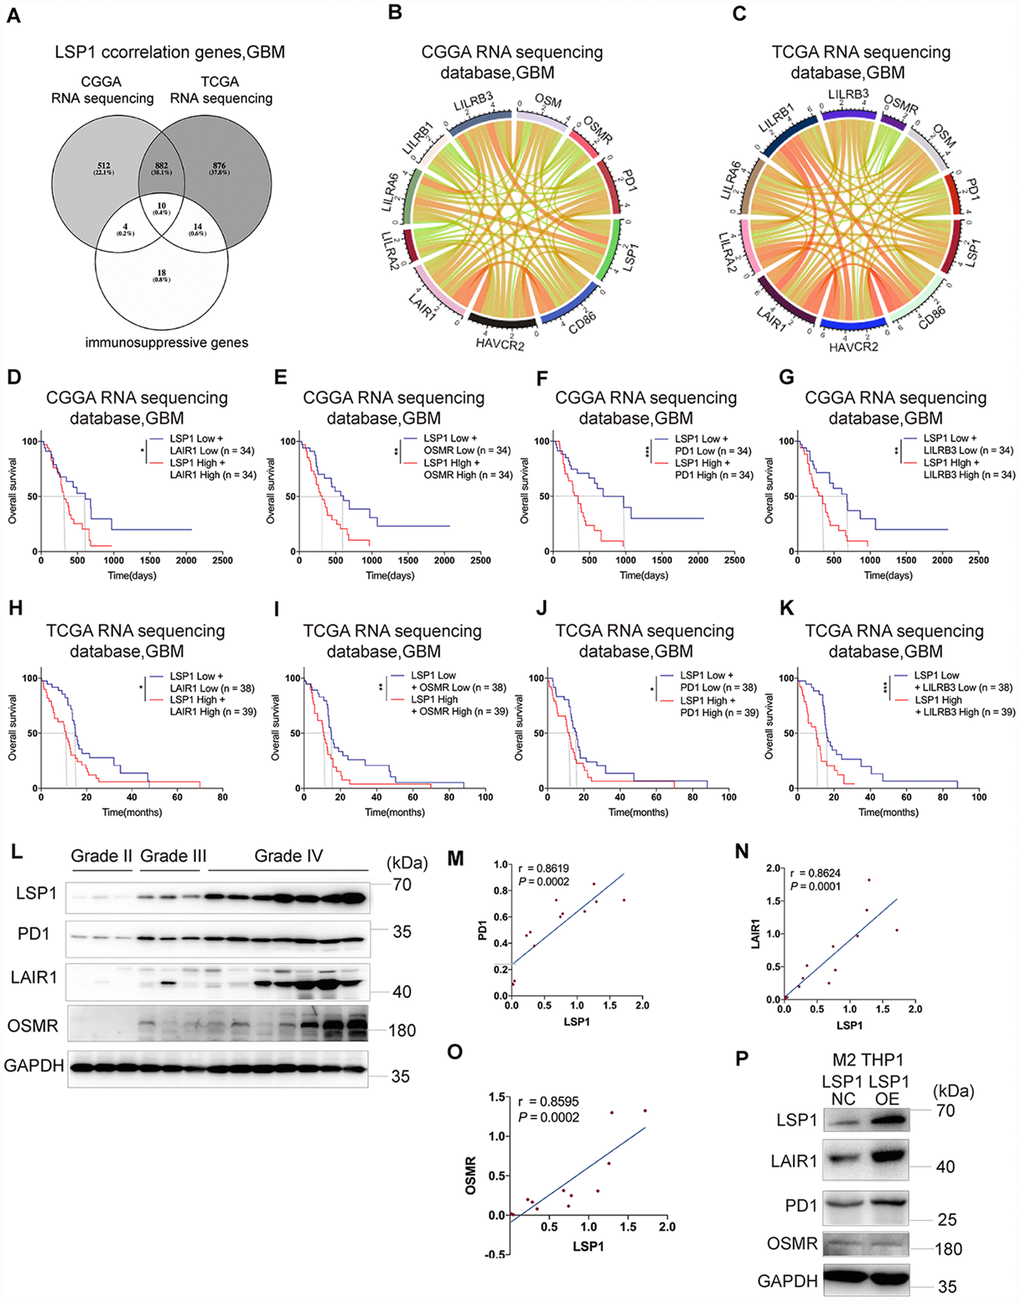
Figure 6. The expression of immunosuppressive genes is a major feature in GBM with high LSP1 expression. (A) A venn diagram showing the 10 overlapping immunosuppressive genes positively correlated with high LSP1 expression in CGGA and TCGA RNA sequencing datasets, and immunosuppressive gene sets. (P < 0.05; with t test). (B and C) Correlation analyses of LSP1 and the above 10 immunosuppressive genes in GBM (B, CGGA RNA sequencing dataset, n = 138; C, TCGA RNA sequencing dataset, n = 155; with Pearson correlation analysis). (D–K) Kaplan-Meier curves describing combined prognostic value of LSP1 and LAIR1, OSMR, PD1, LILRB3 expression in GBM (D–G, CGGA RNA sequencing dataset; H–K, TCGA RNA sequencing dataset; with log-rank test). (L) Representative western blot images of LSP1, PD1, LAIR1 and OSMR in clinical tissues (Grade II n = 3; Grade III n = 3; Grade IV n = 7). (M–O) The correlation analysis of LSP1 with PD1 (M), LAIR1 (N) or OSMR (O) in clinical tissues with western blot (PD1: r = 0.8619, P = 0.0002; LAIR1: r = 0.8624, P = 0.0001; OSMR: r = 0.8595, P = 0.0002; with Pearson correlation analysis). (P) Representative western blot images showing LSP1 overexpression significantly increased PD1 and LAIR1 expression in M2 macrophages induced from THP-1 cells. *, ***, and **** indicate P < 0.05, P < 0.001, and P < 0.0001, respectively. *, **, and *** indicate P < 0.05, P < 0.01, and P < 0.001, respectively. CGGA, Chinese Glioma Genome Atlas; TCGA, The Cancer Genome Atlas; GBM, glioblastoma multiforme.
Discussion
Immune evasion is a hallmark of carcinogenesis [40]. Gaining insight into the biology of immunosuppressive TME in GBM may disclose new therapeutic target for this devastating disease. In this study, among the genes related to leukocyte migration, we found that LSP1 was the only gene which not only had an elevated expression, but also was associated with poor survival in patients with GBM or LGG. We confirmed the potential of LSP1 as a progressive malignancy marker in glioma. LSP1 expression also had a close association with IDH1 wild type tumor, and could be used as an indicator for the survival of GBM patient with radio- and chemotherapy. Finally, LSP1 was associated with immunologic events in GBM. Elevated LSP1 expression promoted macrophage migration and enhanced the expression of immunosuppressive molecules like PD1 and LAIR1 in macrophages.
It is well known that the wild type and mutant form of IDH1 have important impact on the regulation of local immune response and tumorigenesis in glioma [32]. The mutant form of IDH1 attenuated leukocyte chemotaxis, resulting in the repression of local immune system and leaded to immune suppression in GBM TME [32]. Our results revealed that LSP1 had a low expression in IDH1 mutant GBM, which reached the same conclusion with the above report. Future study is needed to further investigate the association and related mechanism between IDH1 and LSP1. Radio- and chemotherapy were the two main treatment strategies for GBM patients after tumor resection, but not all patients could benefit from radiation or chemotherapy. Through our analysis, low LSP1 expression indicated the sensitivity of radio- or chemotherapy in GBM. This may help us to improve individual treatment strategies for GBM patients.
Immune suppression has been recognized as a main characteristic in glioma. Previous study reported that cancer cells could evade destruction through upregulation of immune-checkpoint ligands, such as PD-L1, which can bind complementary receptors on immune cell and cause suppression of lymphocyte activation [7]. We found that the high level of LSP1 expression was closely associated with multiple immune response signaling pathways (Figure 4). LSP1 expression was also significantly correlated with the expression of ten immune regulatory genes, PD1, HAVCR2, LILRA2, LILRB1, LILRB3, LILRB6, LAIR1, CD86, OSMR, and OSM. Because of the important roles of these molecules in mediating immunosuppression, the strong correlations between LSP1 and these molecules may imply a potential role of LSP1 in mediating local immune response. In addition, LSP1 expression was positively associated with the immunosuppressive cell subpopulations, like neutrophils, Tregs, and M2 macrophages and negatively associated with cytotoxic lymphocytes. Since these immunosuppressive cells lead to cytotoxicity CD8+ T cells “exhaustion” [41], LSP1 expression in these cell subpopulations may contribute to the “cold tumor” status of GBM. Additionally, we observed the expression of PD1 and LAIR1 is upregulated in response to LSP1 overexpression in M2 macrophages from THP1 cells. The migration of M0 macrophages was also increased by LSP1 overexpression. These data further support LSP1 contribution to immunosuppression TME in GBM. Future study is needed to clarify the mechanism of their interactions.
In conclusion, according to clinical samples, and multiple dataset profiles, we first revealed an elevated LSP1 expression in GBM compared to LGG. Second, we confirmed the correlation between upregulated LSP1 expression and unfavorable patients’ survival, and increased LSP1 expression was associated with the progressive malignancy in diffuse glioma. Third, we showed the potential of LSP1 as a molecule to predict the response of GBM patients to radiotherapy and chemotherapy. Finally, we find a previous undefined role of LSP1 in the regulation of local immune response in GBM which may contribute to the high lethality of GBM. This may disclose a new aspect to explain the “cold” status of GBM. Taken together, these findings imply the potential of LSP1 as a candidate target in developing novel immune strategies against glioma. Our study may contribute to improving the understanding of the properties and functions of TME in GBM, and help to develop new treatment strategies against glioma.
Materials and Methods
Human specimens and ethics
This study was approved by the Ethics Committee of the First Hospital of China Medical University. All the clinical samples used in this study were collected at the First Hospital of China Medical University from January, 2011 to March, 2019, including 42 samples (11 cases for grade II, 10 cases for grade III, and 21 cases for grade IV tissue samples) for qPCR, 16 samples (3 cases for non-tumor, 3 cases for grade II, 3 cases for grade III, and 7 cases for grade IV tissue samples) for western blot and 90 samples for immunohistochemistry (5 cases for non-tumor, 7 cases for grade II, 17 cases for grade III, and 61 cases for grade IV, respectively) in which 53 cases of grade IV (GBM) samples for IHC had survival information. The histological diagnoses of these samples were confirmed by two neuropathologists, according to the 2016 World Health Organization (WHO) classification guidelines. The samples were de-identified before processed to laboratories. Informed consent was obtained from each patient.
Cell culture
U87 cells were purchased from GeneChem (Shanghai, China). Human normal astrocytes (NHA) and LN229 cells were obtained from Beijing Neurosurgical Institute. NHA, U87, and LN229 cells were maintained in Dulbecco’s modified Eagle’s medium (DMEM, Gibco) containing 10% fetal bovine serum (FBS, Gibco) and 1% penicillin/streptomycin (Gibco) at 37°C with 5% CO2. Patient-derived primary adherent glioma cells (PGC21) was derived from fresh glioma bulk immediately after operation in the First Hospital of China Medical University, which is cultured in RPMI-1640 medium (Gibco), containing 10% FBS and 1% penicillin/streptomycin (Gibco) at 37°C with 5% CO2. The identities of PGC21 has been authenticated by short tandem repeat (STR) analysis. Human peripheral blood mononuclear cell (PBMC) were isolated by Ficoll-Paque PLUS (GE Healthcare) centrifugation media from health donor’s blood as previously described [38]. THP1 cells were provided by Professor Xin Meng (Department of Biochemistry, China Medical University). THP1 monocytes were primed with 5nM PMA (Sigma) for 48 hours to become monocyte-derived macrophages [42]. M1 phenotype macrophages were activated with lipopolysaccharide (LPS), while M2 phenotype were polarized with interleukin 4 (IL4) [43].
RNA isolation and reverse-transcription quantitative PCR (RT-qPCR)
TRIzol reagent (Invitrogen) was used for RNA isolation. Total RNA was reversely transcribed into cDNA with Prime-Script RT Master Mix (TaKaRa). qPCR was carried out in a thermal cycler (PCR LightCycler 480, Roche) with SYBR Green Master Mix (TaKaRa) as previously described [44]. The primer sequences were as follows: LSP1 (Forward primer: AGGACCGAGTCCCTAAACCG, Reverse primer: CTGGGTGTATTGTTCCAGCCA); GAPDH (Forward primer: GGAGCGAGATCC CTCCAAAAT, Reverse primer: GGCTGTTGTCATACTTCTCATGG). The mRNA expression of target genes was calculated by the 2-ΔΔCT method and normalized to GAPDH mRNA expression [45].
Protein extraction and western blotting
Total protein from each sample was obtained and separated as previously reported [46]. Then the protein was transferred to PVDF membranes (Millipore), followed by 1 hour 5% skimmed milk blocking at room temperature and incubated overnight at 4°C with primary antibodies (LSP1 1:1000, Santa Cruz, sc-53363; OSMR 1:1000, Proteintech, 10982-1-AP; LAIR1 1:1000, Santa Cruz, sc-398141; PD1 1:1000, Proteintech, 66220-1-lg; or GAPDH 1:1000, Proteintech, 10494-1-AP). Secondary antibody incubation was performed with peroxidase-conjugated affinipure goat anti-mouse IgG or anti-rabbit IgG (Proteintech; 1:5000). Protein bands were visualized with chemiluminescence ECL reagents (Tanon) and quantified using Image J software.
Immunohistochemistry (IHC)
The IHC staining and the quantification of staining intensity was performed as previously described with the following primary antibodies respectively (LSP1, Santa Cruz, sc-53363; IBA1, abcam, ab5076; Neurophil Elastase, abcam, ab68672) [44, 46].
Immunofluorescence (IF)
For immunocytochemistry, 4μm thick section slides were prepared from clinical samples. Then the sections were permeabilized with 0.5% Triton X-100 for 20 min. After 5% BSA incubation for 1 h, primary antibody (LSP-1, Santa Cruz, sc-53363; GFAP, Proteintech, 16825-1-AP; Neurophil Elastase, abcam, ab6867; IBA1, abcam, ab5076) was added and incubated at 4°C overnight. Following incubation with fluorescein (FITC) or rhodamine (TRITC) secondary antibody and 4’,6-diamidino-2-phenylindole (DAPI), the samples were detected using fluorescence microscope (Leica DMi8).
Data collection for LSP1 expression, survival, and function analysis
The following transcriptome datasets from patients diagnosed with glioma (WHO II-IV) were employed for LSP1 expression, survival, and function analyses: CGGA datasets (RNAseq: n = 310; mRNA microarray: n = 298) (http://www.cgga.org.cn), and TCGA datasets (RNAseq: n = 625; 4502A mRNA microarray: n = 488; U133 mRNA microarray: n = 525) (http://gliovis.bioinfo.cnio.es/) [47]. Only the samples with expression and survival information were included.
Gene ontology (GO) and kyoto encyclopedia of genes and genomes (KEGG) analysis
After Pearson correlation analysis, gene ontology (GO) analysis of the genes positively related with high expression of LSP1 was constructed in two datasets of GBM, CGGA RNAseq and TCGA RNAseq, respectively. GO analysis were performed with DAVID 6.8 (https://david.ncifcrf.gov/tools.jsp) [48]. Then, the overlapping upregulated genes associated with high level of LSP1 expression were summarized from CGGA and TCGA RNAseq datasets, GBM. The relevant signaling pathways of high level of LSP1 expression from KEGG were analyzed by ClueGO [49].
Gene set enrichment analysis (GSEA) and gene set variation analysis (GSVA)
GSEA (http://www.broadinstitute.org/gsea/index.jsp) was applied to investigate LSP1 associated biological function. Normalized enrichment score (NES) and false discovery rate (FDR) were used to determine the statistical significances according to a previous report [50]. GSVA (http://www.bioconductor.org) was used to further validate the association between LSP1 and the candidate functions. GSVA was also implemented to investigate the relationship between 24 types of non-tumor cell subpopulations and LSP1 expression.
Transwell assay
Transwell assay was performed with 8μm inserts (Corning, 3422) as previously described [51].
Statistical analysis
R language (version 3.5.2; R packages, including pheatmap, corrplot, and circus) and GraphPad Prism 7 software (version 7.0) were used for statistical analyses and generating figures, unless mentioned elsewhere. Statistical significance was defined as P value < 0.05. Significant quantitative differences between and among groups were determined by two-tailed t test and one-way ANOVA, respectively. The univariate and multivariate Cox regression analyses were performed for evaluating the prognostic variables. A Kaplan-Meier survival analysis was used to estimate the survival distribution, using the median value as the cutoff. Genes that showed differential expression between GBM and LGG cohorts from the two datasets were extracted by volcano plot using GraphPad Prism 7. The ROC curve was plotted, and the area under the ROC curve (AUC) of each cutoff was measured by GraphPad Prism 7.
Supplementary Materials
Author Contributions
Conception and design: Q. Guo, P. Cheng, A.H. Wu, and G.Y. Li; Development of methodology: Q. Guo, G.F. Guan, L.Y. Zhang and J. Y. Cao; Acquisition of data: J.Y. Cao, C. Zhu, and W. Cheng; Analysis and interpretation of data: J.Y. Cao, C. Y. Zou and Q. Guo; Writing, review, and / or revision of the manuscripts: J.Y. Cao, Q. Guo, G.L. Wang, P. Cheng, and A. H. Wu; Study supervisions: A.H. Wu, and G.Y. Li.
Acknowledgments
We thank all the members in Dr. Wu AH’s lab for helpful discussion to our study.
Conflicts of Interest
The authors declare that they have no competing interests.
Funding
This study was supported by National Natural Science Foundation of China (no. 81872057 to P. Cheng, and no. 81172409, 81472360, and 81872054 to A. Wu;); Science and Technology Project of Education Department of Liaoning Province (no. LFWK201705, to G. Li), Liaoning Science and Technology Plan Projects (no. 2011225034, to A. Wu, and Natural Science Foundation of Liaoning Province (no. 20180550063, to P. Cheng; no.20170541020, to G. Wang); Science and Technology Project of Shenyang (no. 18-014-4-03, to G. Li).
References
- 1. Wolchok JD, Chiarion-Sileni V, Gonzalez R, Rutkowski P, Grob JJ, Cowey CL, Lao CD, Wagstaff J, Schadendorf D, Ferrucci PF, Smylie M, Dummer R, Hill A, et al. Overall Survival with Combined Nivolumab and Ipilimumab in Advanced Melanoma. N Engl J Med. 2017; 377:1345–56. https://doi.org/10.1056/NEJMoa1709684 [PubMed]
- 2. Paucek RD, Baltimore D, Li G. The Cellular Immunotherapy Revolution: Arming the Immune System for Precision Therapy. Trends Immunol. 2019; 40:292–309. https://doi.org/10.1016/j.it.2019.02.002 [PubMed]
- 3. Renrick AN, Dunbar ZT, Shanker A. Update on the current revolution in cancer immunotherapy. Immunotherapy. 2019; 11:15–20. https://doi.org/10.2217/imt-2018-0135 [PubMed]
- 4. Ribas A, Wolchok JD. Cancer immunotherapy using checkpoint blockade. Science. 2018; 359:1350–55. https://doi.org/10.1126/science.aar4060 [PubMed]
- 5. Majzner RG, Heitzeneder S, Mackall CL. Harnessing the Immunotherapy Revolution for the Treatment of Childhood Cancers. Cancer Cell. 2017; 31:476–85. https://doi.org/10.1016/j.ccell.2017.03.002 [PubMed]
- 6. Zhao J, Chen AX, Gartrell RD, Silverman AM, Aparicio L, Chu T, Bordbar D, Shan D, Samanamud J, Mahajan A, Filip I, Orenbuch R, Goetz M, et al. Immune and genomic correlates of response to anti-PD-1 immunotherapy in glioblastoma. Nat Med. 2019; 25:462–9. https://doi.org/10.1038/s41591-019-0349-y [PubMed]
- 7. Lim M, Xia Y, Bettegowda C, Weller M. Current state of immunotherapy for glioblastoma. Nat Rev Clin Oncol. 2018; 15:422–42. https://doi.org/10.1038/s41571-018-0003-5 [PubMed]
- 8. Sharma P, Hu-Lieskovan S, Wargo JA, Ribas A. Primary, Adaptive, and Acquired Resistance to Cancer Immunotherapy. Cell. 2017; 168:707–23. https://doi.org/10.1016/j.cell.2017.01.017 [PubMed]
- 9. Gibney GT, Weiner LM, Atkins MB. Predictive biomarkers for checkpoint inhibitor-based immunotherapy. Lancet Oncol. 2016; 17:e542–51. https://doi.org/10.1016/S1470-2045(16)30406-5 [PubMed]
- 10. Chen DS, Mellman I. Elements of cancer immunity and the cancer-immune set point. Nature. 2017; 541:321–30. https://doi.org/10.1038/nature21349 [PubMed]
- 11. Li B, Cui Y, Nambiar DK, Sunwoo JB, Li R. The immune subtypes and landscape of squamous cell carcinoma. Clin Cancer Res. 2019; 25:3528–37. https://doi.org/10.1158/1078-0432.CCR-18-4085 [PubMed]
- 12. Ostrom QT, Gittleman H, Liao P, Vecchione-Koval T, Wolinsky Y, Kruchko C, Barnholtz-Sloan JS. CBTRUS Statistical Report: Primary brain and other central nervous system tumors diagnosed in the United States in 2010-2014. Neuro Oncol. 2017; 19:v1–v88. https://doi.org/10.1093/neuonc/nox158 [PubMed]
- 13. Quail DF, Joyce JA. The Microenvironmental Landscape of Brain Tumors. Cancer Cell. 2017; 31:326–41. https://doi.org/10.1016/j.ccell.2017.02.009 [PubMed]
- 14. Tomaszewski W, Sanchez-Perez L, Gajewski TF, Sampson JH. Brain Tumor Microenvironment and Host State: implications for Immunotherapy. Clin Cancer Res. 2019; 25:4202–10. https://doi.org/10.1158/1078-0432.CCR-18-1627 [PubMed]
- 15. Cloughesy TF, Mochizuki AY, Orpilla JR, Hugo W, Lee AH, Davidson TB, Wang AC, Ellingson BM, Rytlewski JA, Sanders CM, Kawaguchi ES, Du L, Li G, et al. Neoadjuvant anti-PD-1 immunotherapy promotes a survival benefit with intratumoral and systemic immune responses in recurrent glioblastoma. Nat Med. 2019; 25:477–86. https://doi.org/10.1038/s41591-018-0337-7 [PubMed]
- 16. Grivennikov SI, Greten FR, Karin M. Immunity, inflammation, and cancer. Cell. 2010; 140:883–99. https://doi.org/10.1016/j.cell.2010.01.025 [PubMed]
- 17. Palucka AK, Coussens LM. The Basis of Oncoimmunology. Cell. 2016; 164:1233–47. https://doi.org/10.1016/j.cell.2016.01.049 [PubMed]
- 18. De Palma M, Venneri MA, Galli R, Sergi Sergi L, Politi LS, Sampaolesi M, Naldini L. Tie2 identifies a hematopoietic lineage of proangiogenic monocytes required for tumor vessel formation and a mesenchymal population of pericyte progenitors. Cancer Cell. 2005; 8:211–26. https://doi.org/10.1016/j.ccr.2005.08.002 [PubMed]
- 19. Liang J, Piao Y, Holmes L, Fuller GN, Henry V, Tiao N, de Groot JF. Neutrophils promote the malignant glioma phenotype through S100A4. Clin Cancer Res. 2014; 20:187–98. https://doi.org/10.1158/1078-0432.CCR-13-1279 [PubMed]
- 20. Maxeiner S, Shi N, Schalla C, Aydin G, Hoss M, Vogel S, Zenke M, Sechi AS. Crucial role for the LSP1-myosin1e bimolecular complex in the regulation of Fcγ receptor-driven phagocytosis. Mol Biol Cell. 2015; 26:1652–64. https://doi.org/10.1091/mbc.E14-05-1005 [PubMed]
- 21. Hwang SH, Jung SH, Lee S, Choi S, Yoo SA, Park JH, Hwang D, Shim SC, Sabbagh L, Kim KJ, Park SH, Cho CS, Kim BS, et al. Leukocyte-specific protein 1 regulates T-cell migration in rheumatoid arthritis. Proc Natl Acad Sci USA. 2015; 112:E6535–43. https://doi.org/10.1073/pnas.1514152112 [PubMed]
- 22. Howard TH, Hartwig J, Cunningham C. Lymphocyte-specific protein 1 expression in eukaryotic cells reproduces the morphologic and motile abnormality of NAD 47/89 neutrophils. Blood. 1998; 91:4786–95. https://doi.org/10.1182/blood.V91.12.4786 [PubMed]
- 23. Jongstra-Bilen J, Jongstra J. Leukocyte-specific protein 1 (LSP1): a regulator of leukocyte emigration in inflammation. Immunol Res. 2006; 35:65–74. https://doi.org/10.1385/IR:35:1:65 [PubMed]
- 24. Koral K, Haynes M, Bowen WC, Orr A, Mars W, Michalopoulos GK. Lymphocyte-Specific Protein-1 Controls Sorafenib Sensitivity and Hepatocellular Proliferation through Extracellular Signal-Regulated Kinase 1/2 Activation. Am J Pathol. 2018; 188:2074–86. https://doi.org/10.1016/j.ajpath.2018.06.005 [PubMed]
- 25. Cervero P, Wiesner C, Bouissou A, Poincloux R, Linder S. Lymphocyte-specific protein 1 regulates mechanosensory oscillation of podosomes and actin isoform-based actomyosin symmetry breaking. Nat Commun. 2018; 9:515. https://doi.org/10.1038/s41467-018-02904-x [PubMed]
- 26. Galon J, Bruni D. Approaches to treat immune hot, altered and cold tumours with combination immunotherapies. Nat Rev Drug Discov. 2019; 18:197–218. https://doi.org/10.1038/s41573-018-0007-y [PubMed]
- 27. David BA, Kubes P. Exploring the complex role of chemokines and chemoattractants in vivo on leukocyte dynamics. Immunol Rev. 2019; 289:9–30. https://doi.org/10.1111/imr.12757 [PubMed]
- 28. Liberzon A, Subramanian A, Pinchback R, Thorvaldsdóttir H, Tamayo P, Mesirov JP. Molecular signatures database (MSigDB) 3.0. Bioinformatics. 2011; 27:1739–40. https://doi.org/10.1093/bioinformatics/btr260 [PubMed]
- 29. Kloosterhof NK, Bralten LB, Dubbink HJ, French PJ, van den Bent MJ. Isocitrate dehydrogenase-1 mutations: a fundamentally new understanding of diffuse glioma? Lancet Oncol. 2011; 12:83–91. https://doi.org/10.1016/S1470-2045(10)70053-X [PubMed]
- 30. Balss J, Meyer J, Mueller W, Korshunov A, Hartmann C, von Deimling A. Analysis of the IDH1 codon 132 mutation in brain tumors. Acta Neuropathol. 2008; 116:597–602. https://doi.org/10.1007/s00401-008-0455-2 [PubMed]
- 31. Turcan S, Rohle D, Goenka A, Walsh LA, Fang F, Yilmaz E, Campos C, Fabius AW, Lu C, Ward PS, Thompson CB, Kaufman A, Guryanova O, et al. IDH1 mutation is sufficient to establish the glioma hypermethylator phenotype. Nature. 2012; 483:479–83. https://doi.org/10.1038/nature10866 [PubMed]
- 32. Amankulor NM, Kim Y, Arora S, Kargl J, Szulzewsky F, Hanke M, Margineantu DH, Rao A, Bolouri H, Delrow J, Hockenbery D, Houghton AM, Holland EC. Mutant IDH1 regulates the tumor-associated immune system in gliomas. Genes Dev. 2017; 31:774–86. https://doi.org/10.1101/gad.294991.116 [PubMed]
- 33. Fanale D, Amodeo V, Corsini LR, Rizzo S, Bazan V, Russo A. Breast cancer genome-wide association studies: there is strength in numbers. Oncogene. 2012; 31:2121–28. https://doi.org/10.1038/onc.2011.408 [PubMed]
- 34. Marafioti T, Jabri L, Pulford K, Brousset P, Mason DY, Delsol G. Leucocyte-specific protein (LSP1) in malignant lymphoma and Hodgkin’s disease. Br J Haematol. 2003; 120:671–78. https://doi.org/10.1046/j.1365-2141.2003.04137.x [PubMed]
- 35. Aldape K, Brindle KM, Chesler L, Chopra R, Gajjar A, Gilbert MR, Gottardo N, Gutmann DH, Hargrave D, Holland EC, Jones DT, Joyce JA, Kearns P, et al. Challenges to curing primary brain tumours. Nat Rev Clin Oncol. 2019; 16:509–20. https://doi.org/10.1038/s41571-019-0177-5 [PubMed]
- 36. Hegi ME, Diserens AC, Gorlia T, Hamou MF, de Tribolet N, Weller M, Kros JM, Hainfellner JA, Mason W, Mariani L, Bromberg JE, Hau P, Mirimanoff RO, et al. MGMT gene silencing and benefit from temozolomide in glioblastoma. N Engl J Med. 2005; 352:997–1003. https://doi.org/10.1056/NEJMoa043331 [PubMed]
- 37. Xiao Y, Ma D, Zhao S, Suo C, Shi J, Xue MZ, Ruan M, Wang H, Zhao J, Li Q, Wang P, Shi L, Yang WT, et al, and AME Breast Cancer Collaborative Group. Multi-omics profiling reveals distinct microenvironment characterization and suggests immune escape mechanisms of triple-negative breast cancer. Clin Cancer Res. 2019; 25:5002–14. https://doi.org/10.1158/1078-0432.CCR-18-3524 [PubMed]
- 38. Zhou W, Ke SQ, Huang Z, Flavahan W, Fang X, Paul J, Wu L, Sloan AE, McLendon RE, Li X, Rich JN, Bao S. Periostin secreted by glioblastoma stem cells recruits M2 tumour-associated macrophages and promotes malignant growth. Nat Cell Biol. 2015; 17:170–82. https://doi.org/10.1038/ncb3090 [PubMed]
- 39. Zhang C, Cheng W, Ren X, Wang Z, Liu X, Li G, Han S, Jiang T, Wu A. Tumor Purity as an Underlying Key Factor in Glioma. Clin Cancer Res. 2017; 23:6279–91. https://doi.org/10.1158/1078-0432.CCR-16-2598 [PubMed]
- 40. Hanahan D, Weinberg RA. Hallmarks of cancer: the next generation. Cell. 2011; 144:646–74. https://doi.org/10.1016/j.cell.2011.02.013 [PubMed]
- 41. Bezzi M, Seitzer N, Ishikawa T, Reschke M, Chen M, Wang G, Mitchell C, Ng C, Katon J, Lunardi A, Signoretti S, Clohessy JG, Zhang J, Pandolfi PP. Diverse genetic-driven immune landscapes dictate tumor progression through distinct mechanisms. Nat Med. 2018; 24:165–75. https://doi.org/10.1038/nm.4463 [PubMed]
- 42. Grkovich A, Johnson CA, Buczynski MW, Dennis EA. Lipopolysaccharide-induced cyclooxygenase-2 expression in human U937 macrophages is phosphatidic acid phosphohydrolase-1-dependent. J Biol Chem. 2006; 281:32978–87. https://doi.org/10.1074/jbc.M605935200 [PubMed]
- 43. Halbrook CJ, Pontious C, Kovalenko I, Lapienyte L, Dreyer S, Lee HJ, Thurston G, Zhang Y, Lazarus J, Sajjakulnukit P, Hong HS, Kremer DM, Nelson BS, et al. Macrophage-Released Pyrimidines Inhibit Gemcitabine Therapy in Pancreatic Cancer. Cell Metab. 2019; 29:1390–99.e6. https://doi.org/10.1016/j.cmet.2019.02.001 [PubMed]
- 44. Guo Q, Guan GF, Cao JY, Zou CY, Zhu C, Cheng W, Xu XY, Lin ZG, Cheng P, Wu AH. Overexpression of oncostatin M receptor regulates local immune response in glioblastoma. J Cell Physiol. 2019; 234:15496–509. https://doi.org/10.1002/jcp.28197 [PubMed]
- 45. Schmittgen TD, Livak KJ. Analyzing real-time PCR data by the comparative C(T) method. Nat Protoc. 2008; 3:1101–08. https://doi.org/10.1038/nprot.2008.73 [PubMed]
- 46. Guo Q, Guan GF, Cheng W, Zou CY, Zhu C, Cheng P, Wu AH. Integrated profiling identifies caveolae-associated protein 1 as a prognostic biomarker of malignancy in glioblastoma patients. CNS Neurosci Ther. 2019; 25:343–54. https://doi.org/10.1111/cns.13072 [PubMed]
- 47. Bowman RL, Wang Q, Carro A, Verhaak RG, Squatrito M. GlioVis data portal for visualization and analysis of brain tumor expression datasets. Neuro-Oncol. 2017; 19:139–41. https://doi.org/10.1093/neuonc/now247 [PubMed]
- 48. Huang W, Sherman BT, Lempicki RA. Systematic and integrative analysis of large gene lists using DAVID bioinformatics resources. Nat Protoc. 2009; 4:44–57. https://doi.org/10.1038/nprot.2008.211 [PubMed]
- 49. Bindea G, Mlecnik B, Hackl H, Charoentong P, Tosolini M, Kirilovsky A, Fridman WH, Pagès F, Trajanoski Z, Galon J. ClueGO: a Cytoscape plug-in to decipher functionally grouped gene ontology and pathway annotation networks. Bioinformatics. 2009; 25:1091–93. https://doi.org/10.1093/bioinformatics/btp101 [PubMed]
- 50. Subramanian A, Tamayo P, Mootha VK, Mukherjee S, Ebert BL, Gillette MA, Paulovich A, Pomeroy SL, Golub TR, Lander ES, Mesirov JP. Gene set enrichment analysis: a knowledge-based approach for interpreting genome-wide expression profiles. Proc Natl Acad Sci USA. 2005; 102:15545–50. https://doi.org/10.1073/pnas.0506580102 [PubMed]
- 51. Cheng P, Gao ZQ, Liu YH, Xue YX. Platelet-derived growth factor BB promotes the migration of bone marrow-derived mesenchymal stem cells towards C6 glioma and up-regulates the expression of intracellular adhesion molecule-1. Neurosci Lett. 2009; 451:52–56. https://doi.org/10.1016/j.neulet.2008.12.044 [PubMed]