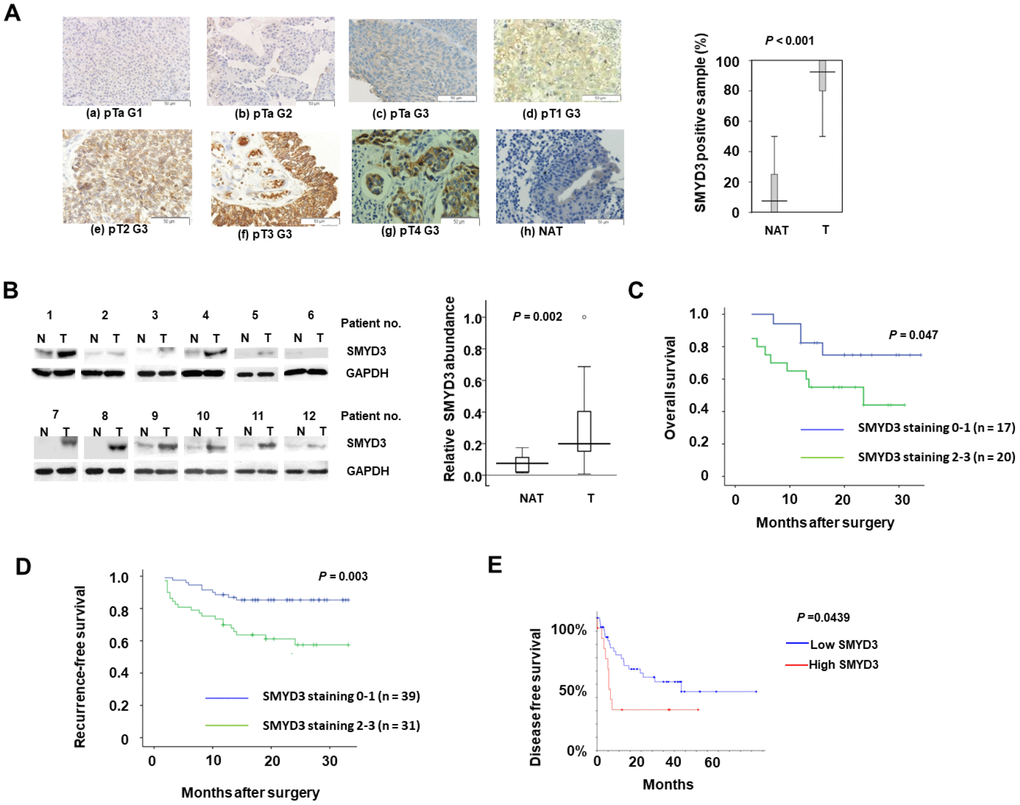
Figure 1.SMYD3 is upregulated in BC tumors and serves as a poor prognostic indicator of BC. (A) SMYD3 expression in representative BC tumors (T) and NAT (please define NAT: non-cancerous adjacent tissues?) (n=65) analyzed using IHC (Magnification: ×200). The Tukey box-and whiskers plot shows the percentage of positive IHC staining SMYD3 in 65 BC tumors and NAT. A set of Wilcoxin tests for paired groups was used to calculate the two-sided P values. (a-g: BC tumors; h: NAT of f). (B) Representative images of Western blot analysis of SMYD3 expression in 25 pairs of frozen BC tumors (T) and corresponding non-cancerous bladder tissues (N). The Tukey box-and whiskers plot shows the quantification of the Western blot signals. A set of Wilcoxin tests for paired samples was used to calculate the two-sided P values. (C) Kaplan-Meier plot comparing survival of BC patients undertaken radical cystectomy based upon SMYD3 expression. Statistical significance was determined by log-rank test. (D) Kaplan-Meier plot comparing survival of recurrence of BC patients undertaken TURBT (Define it) based upon SMYD3 expression. Statistical significance was determined by log-rank test. (E) Kaplan-Meier plot comparing DFS of BC patients according SMYD3 mRNA abundance from the TCGA dataset and analyses were described in Materials and Methods. Statistical significance was determined by log-rank test.