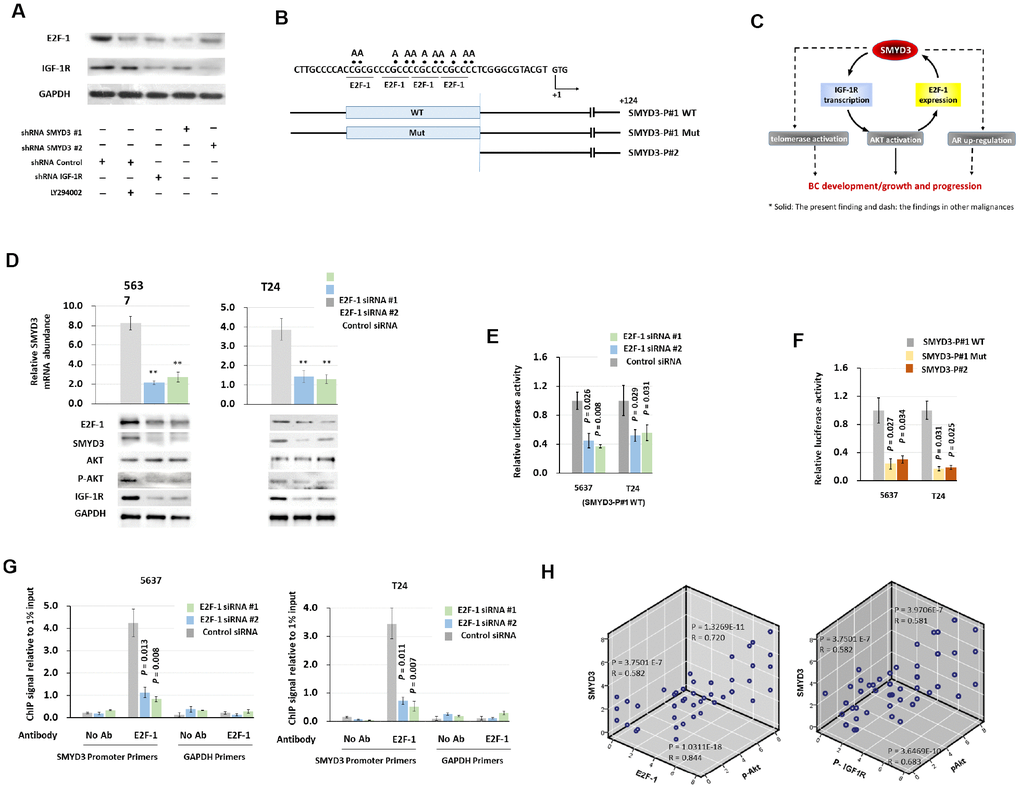
Figure 5.SMYD3 forms a positive feedback loop with IGF-1R/AKT/E2F-1 axis. (A) Western blot analysis of E2F-1 and IGF-1R protein expression in T24 cells 48 h post transfected with indicated vectors and treated with LY294002 (20μmol/L). (B) Schematic presentation of putative E2F-1–binding domains in the 5' flanking region of SMYD3. Reporter vector contained either wild type (SMYD3-P#1 WT) or mutant (SMYD3-P#1mt) E2F-1–binding sequences. +1: transcription start site. (C) A model of a positive feedback loop, involving SMYD3, IGF-1R and E2F-1, that sustains AKT activation, promotes BC development and progression. (D) qPCR and Western blot analysis of SMYD3 expression in 5637 and T24 cells transfected with E2F-1 siRNAs or control siRNA. Bars: SD. Wilcoxon signed-rank tests for the paired samples were used to calculate the two-sided P values based on six independent transfections. ** P < 0.01. (E) E2F-1 siRNA were co-transfected with WT SMYD3-P#1 into 5637 and T24 cells. Luciferase activity assay was performed 48 hours after transfection. Six independent transfections were performed. Bar: SD. A Wilcoxon signed-rank test for the paired samples was used to calculate the two-sided P value. (F) WT, E2F-1 motif mutant, or truncated SMYD3 promoter activity in 5637 or T24 cells. Three independent experiments were performed in triplicates. Bar: SD. A Wilcoxon signed-rank test for the paired samples was used to calculate the two-sided P value. (G) Quantitative chromatin immunoprecipitation (ChIP) assay forE2F-1 occupancy at the SMYD3 promoter in 5637(left) or T24 (right) cells treated with the E2F-1 siRNA or control siRNA). Omission of antibodies (No Ab) was included in the whole experimental procedure, together with the PCR amplification of unrelated GAPDH gene, as appropriate controls. Data shown are from four independent transfections. Mean values of ChIP signals are normalized to 1% input. Input control was from non-immunoprecipitated total chromatin DNA. Bar: SD. Mann–Whitney U tests were used to calculate the two-sided P values. (H) The correlation among concurrent immunostaining scores of SMYD3, E2F-1, p-IGF-1R and p-AKT in BC tissues. The Spearman test was used in analyzing the correlation.