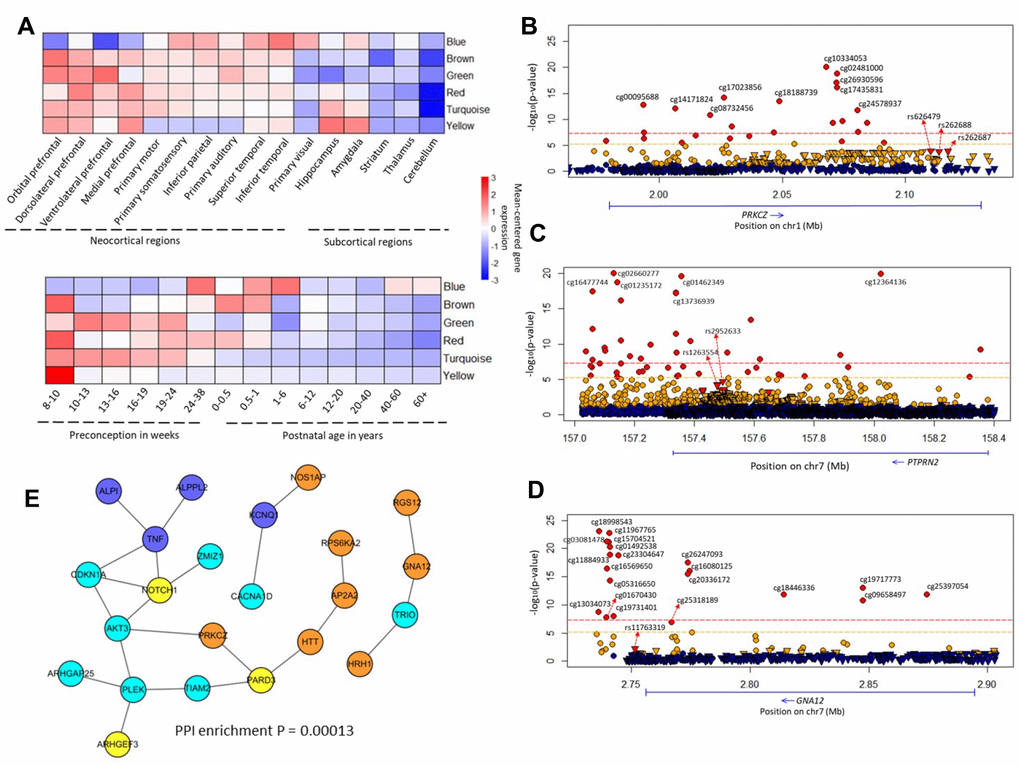
Figure 2.Brain co-expression modules and common methylated genes. (A) Regional and temporal patterns of gene expression mean-centered by the extent of gene expression within each module. (B–D) Regional plot of association between genetic and epigenetic variants of the PRKCZ, PTPRN2, GNA12 loci, and SCZ, respectively. Circular symbols indicate the association of CpG loci with SCZ (red represents loci significantly associated with SCZ with P ≤ 6.07 × 10⁻⁶; orange indicates loci with 6.07 × 10⁻⁶ < P ≤ 0.05; blue marks loci with P > 0.05). Triangular symbols indicate association of SNPs with SCZ (red represents top-ranked SNPs associated with SCZ; orange indicates SNPs associated with SCZ with P ≤ 0.05; blue marks SNPs with P > 0.05). (E) Gene subnetwork constituted from the 34 common genes. The protein–protein interactions are according to the database of STRING (v. 10.5). We used Cytoscape software to visualize the subnetwork. The color of a node indicates the co-expression module of the genes.