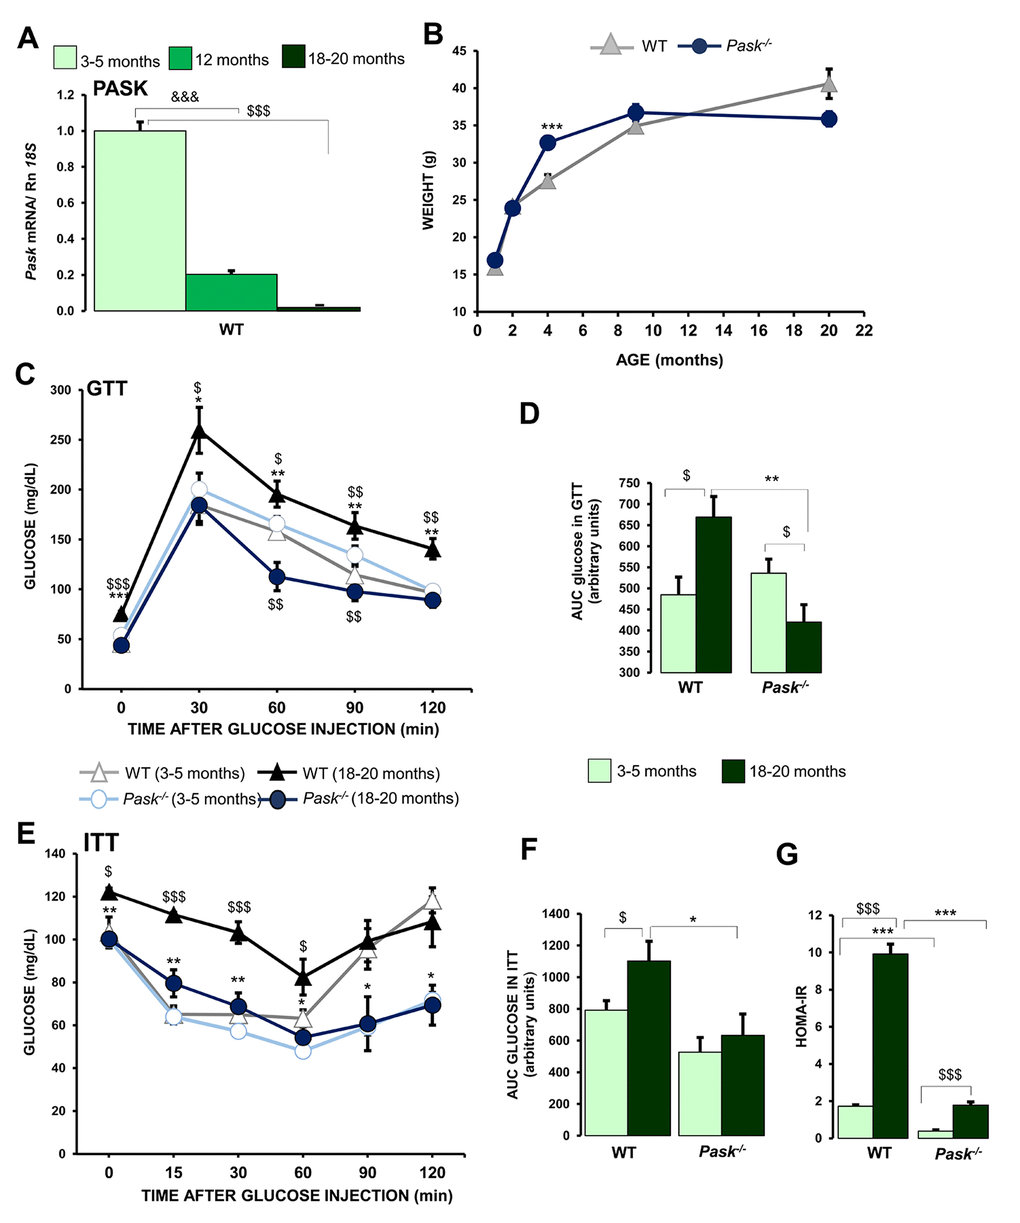
Figure 1.Effects of aging in the regulation of hepatic PASK expression, and parameters affected by aging: glucose tolerance, action of insulin and lipid-related parameters. Real-time PCR was used to analyze the expression of Pask (A) mRNA levels in livers from 3-5 months (young), 12-months, and 18-20 months (aged) wild-type (WT) mice. The value obtained for 3-5-month-old WT mice was taken as 1. &&&P < 0.001 3-5 months vs. 12 months; $$$P < 0.001 3-5 months vs. 18-20 months. (B) Comparison of growth curves of Δ WT and ● PASK-deficient mice, weight is means ± SEM. *** P < 0.001 WT vs. Pask-/- (C–F) Glucose and insulin tolerance tests (GTT/ITT); serum glucose levels (mg/dL) were measured before and several times after an IP glucose (C, D) or insulin (E, F) injection in mice of Δ 3-5 months or ▲18-20 months WT and ○ 3-5 months or ● 18-20 months PASK-deficient mice (Pask-/-). Line graphs represent the means ± SEM; n = 8-11 animals per condition. $P < 0.05, $$P < 0.01, $$$P < 0.001 3-5 months vs. 18-20 months; * P < 0.05, ** P < 0.01, *** P < 0.001 aged WT vs. aged Pask-/-. Area under the curve for glucose (AUCglucose) (D) and insulin (AUCinsulin) (F). HOMA-IR values (G). (D, F, G) values are expressed as the means ± SEM in WT mice aged 3-5 months or 18-20 months and PASK-deficient mice (Pask-/-) aged 3-5 months or 18-20 months. $P < 0.05, $$$P < 0.001 3-5 months vs. 18-20 months; * P < 0.05, ** P < 0.01, *** P < 0.001 WT vs. Pask-/-.