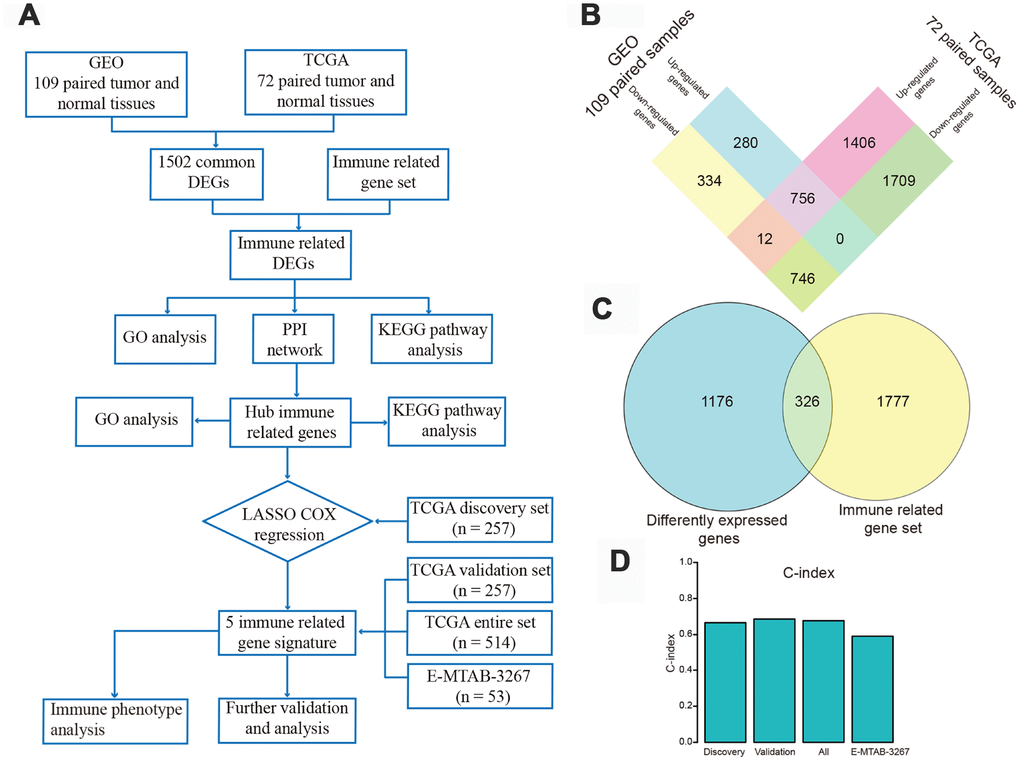
Figure 1.Flow chart of the study design and identification of differentially expressed genes (DEGs). (A) Flow chart of our research project. (B) Using gene expression data of 109 pairs of normal and tumor tissues from Gene Expression Omnibus and 72 paired samples from The Cancer Genome Atlas (TCGA) database, 756 up-regulated and 746 down-regulated DEGs were identified and extracted from the two databases. (C) These DEGs were intersected with a gene set including 2103 immune-related genes (IRGs), and 326 differently expressed IRGs were identified. (D) Harrell's concordance index of the five-gene signature in the TCGA discovery, validation, and entire sets, and in the E-MTAB-3267 dataset.