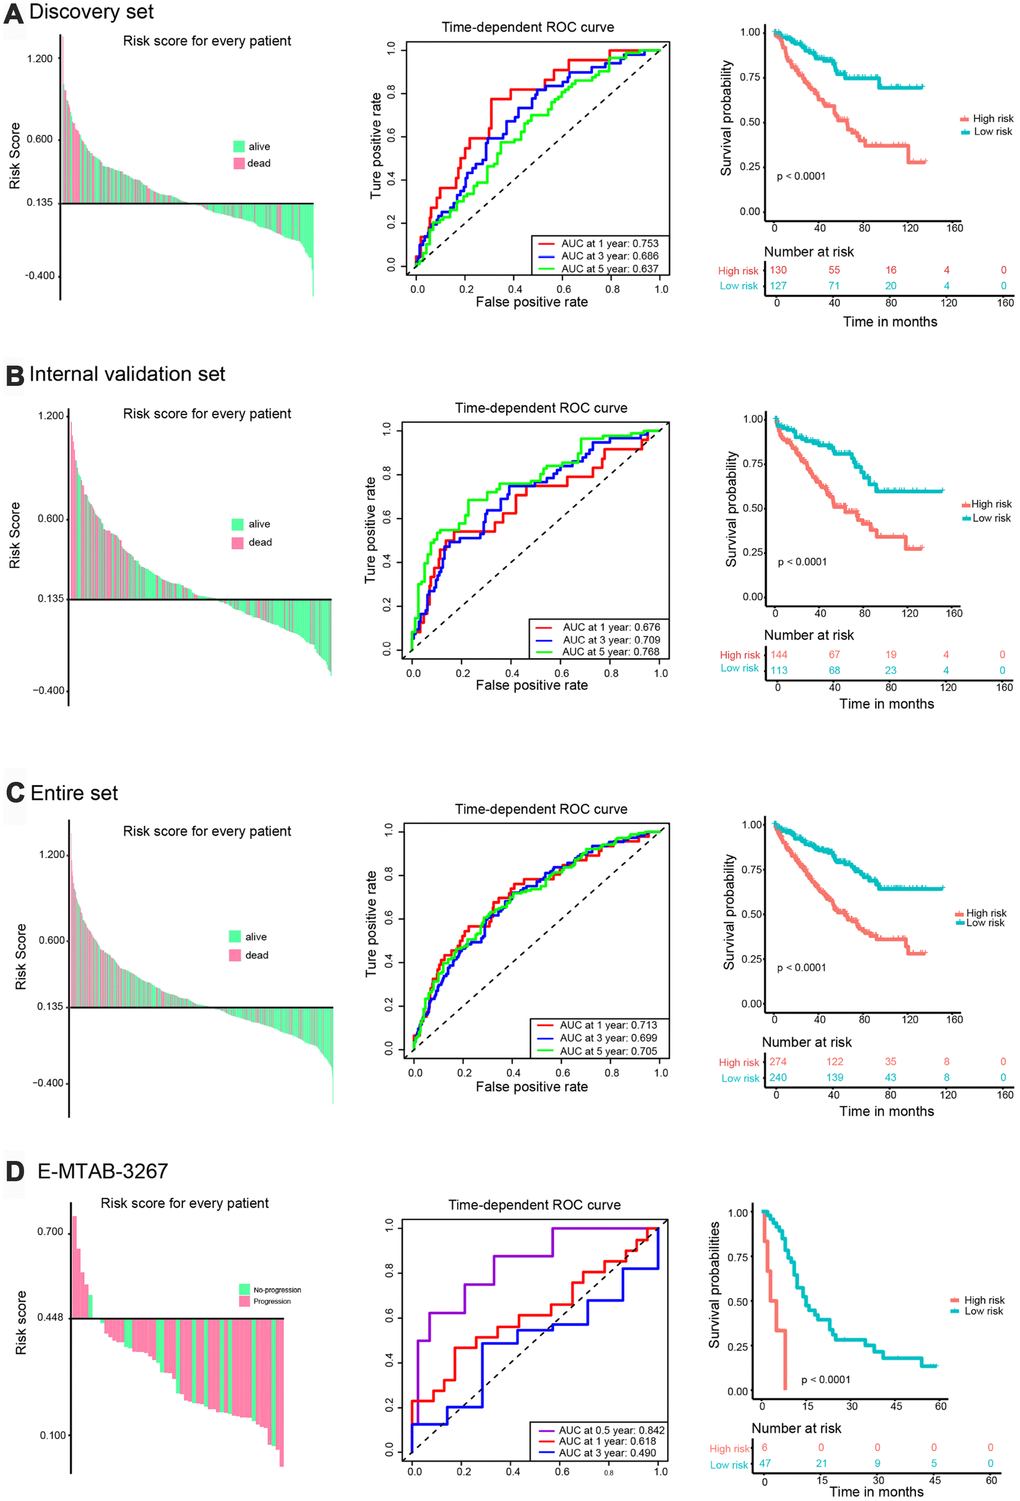
Figure 3.Validation of the prognostic risk signature. Left panel: Distribution of the risk signature based on survival status. High-risk and low-risk patients were distributed above and below the x-axis, respectively. Pink and green colors indicate dead and alive patients, respectively. Middle panel: Time-dependent ROC curves were performed to evaluate the accuracy of the risk signature. Right panel: Kaplan-Meier survival curves were performed to assess patients’ prognosis. (A) TCGA discovery set. (B) Validation set. (C) Entire set. (D) E-MTAB-3267.