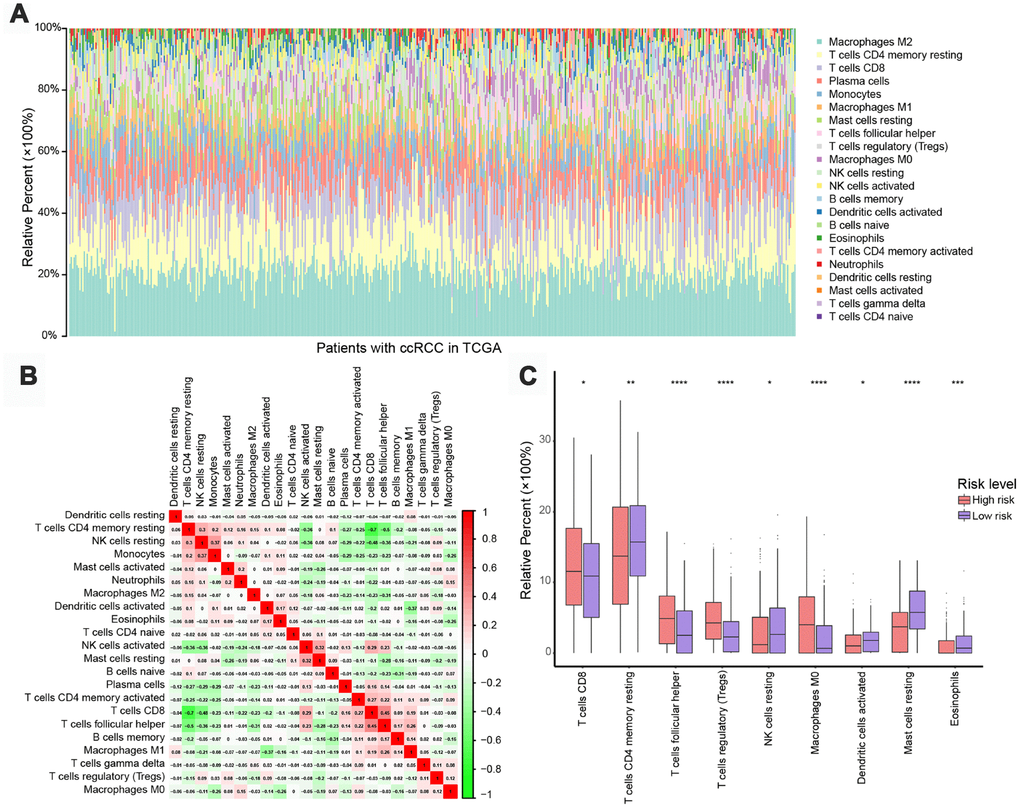
Figure 5.Immune landscapes in high-risk and low-risk patients. (A) Relative proportions of 22 immune cell types in high- and low-risk patients. (B) Correlation matrix of relative proportions of the 22 immune cell types. (C) Box plots showing differential immune cell infiltration status between high- and low-risk patients. *P < 0.05, **P < 0.01, ***P < 0.001, ****P < 0.0001.