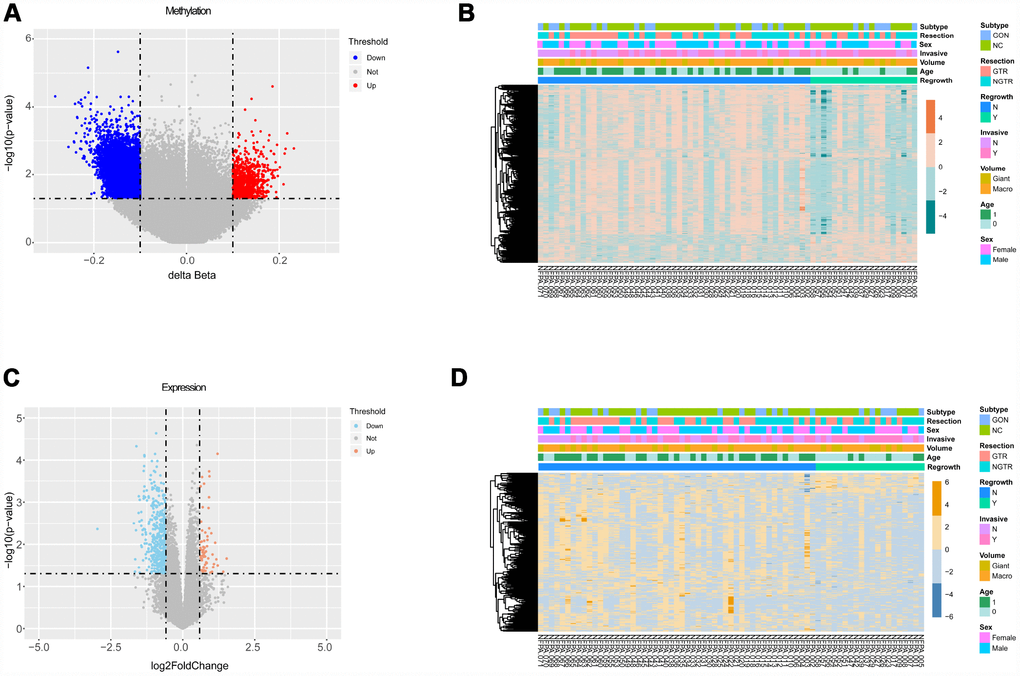
Figure 2.Differential analyses of gene methylation and expression status between regrowth and non-regrowth patients. (A) There are 3329 differentially methylated genes, of which 2788 hypomethylated genes (blue) and 541 hypermethylated genes (red) (B) The heatmap shows methylation profiles of 71 NFPA samples. The rows represent the different probes, and the columns represent each sample. The color in the heatmap represents the methylation level difference, which are hypermethylation (orange) and hypomethylation (green). The bar on the top shows the clinical and grouping information, and the sample ID is on the bottom. (C) The volcano plot shows 501 differentially expressed genes, and there are 438 upregulated genes(red) and 63 downregulated genes (blue). (D) The heatmap shows the expression profiles of the 71 NFPA samples. The rows represent the different genes, and the columns represent each sample. The color in the heatmap represents the expression level difference: upregulated (yellow) and downregulated (blue). The bar on the top shows the clinical and grouping information, and the sample ID is on the bottom.