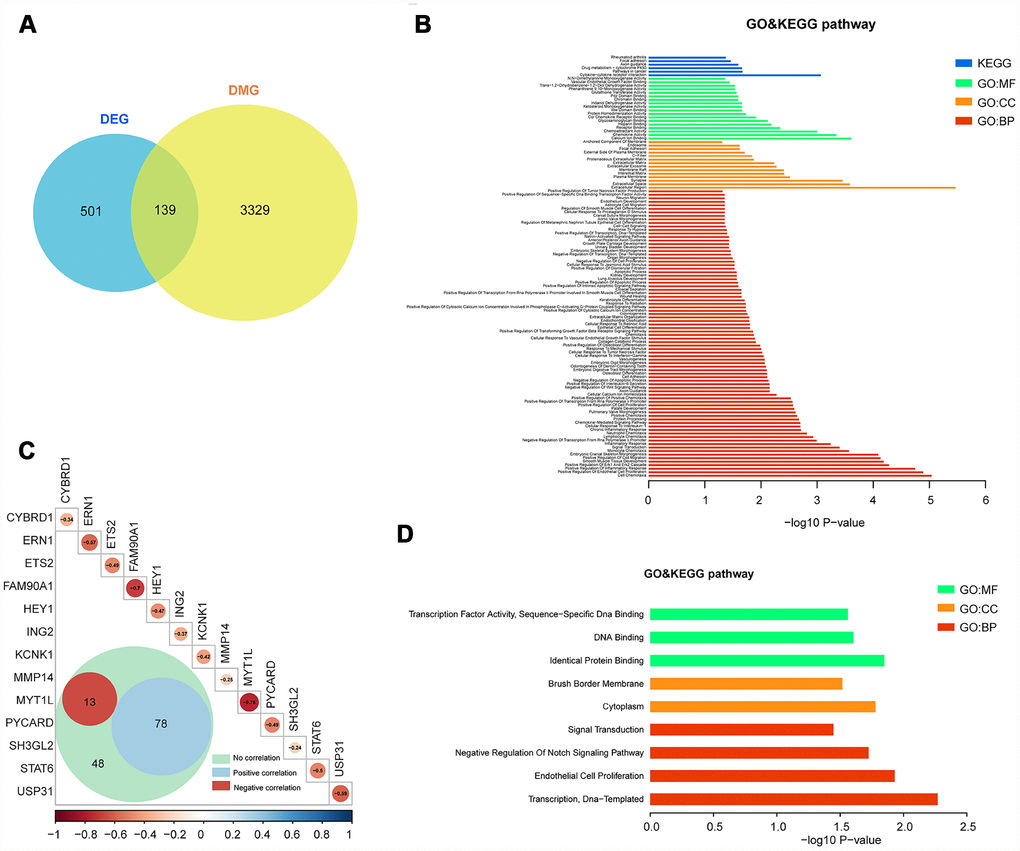
Figure 3.Integrated analysis of DMGs and DEGs. (A) The Venn diagram shows 139 genes with both DNA methylation and expression level changes. (B) GO and KEGG pathway analyses of 139 genes. (C) Pearson analysis of 139 genes. There are 13 genes showing negative correlation (red), 78 genes showing positive correlation (blue) and 48 genes showing no correlation. The R value of 13 genes is shown. (D) GO and KEGG pathway analyses of 13 negative correlation genes.